Stress Testing Programs
Roy Longbottom
ContentsIntroductionDOS and Windows PC CPU Tests DOS and Windows PC Drive Tests Windows Livermore Loops Benchmark Windows Integer Stress Tests Windows Multiprocessor Integer Stress Tests Windows Floating Point Stress Tests Windows Graphics Stress Tests Linux Versions ------- PC Drive Tests ------- Livermore Loops ------- Integer Stress Tests ------- CUDA Graphics Stress Tests ------- OpenGL Graphics Stress Tests Linux Floating Point Stress Tests SummaryThe report provides details of a series of stress tests that cover processor integer and floating point calculations, cache and memory speeds, disk and other drives, including local network traffic, and graphics hardware. The programs can either be run standalone or multiple copies of any at the same time. Some detailed results are provided plus reference to more comprehensive reports. Links to download the test programs is provided, also the source code for those who wish to compile them for other systems or modify them for other purposes [No restrictions except use of existing or modified codes is at your own risk].The programs are based on experience in designing and running stress programs, that were used for acceptance test purposes, on hundreds of computers purchased by the UK Government for Departments and Universities, including mainframes, minicomputers, mini-servers, workstations and supercomputers from the 1970s to the 1990s. Objectives for these later programs are to automatically check results of numeric calculations or data comparisons, save results in a text based log file and, when appropriate, identify ongoing speed of operation and provide variable parameters to specify:
The programs are available, compiled fro both 32 bit and 64 bit systems, to run under Windows or Linux, mainly with run time parameters that can be executed from a BAT or script file, to enable parallel operation of multiple tasks. Integer Test - This memory/arithmetic exerciser comprises 8 write then read and 8 read only tests, using different hexadecimal data patterns, with arithmetic carried out by assembly code, arranged for fast data streaming. Performance is measured in MB/second and MIPS. Floating Point Test - This is another memory/arithmetic exerciser but compiled to use SIMD SSE functions. Speed is measured in MFLOPS. achieving up to 6 per CPU MHz. Drive Test - The program code is essentially the same as used in the acceptance trials mentioned above. Four files are written, sized in multiples of 10.3 MB, with data blocks comprising 164 different binary patterns, then read, with data checked, for a chosen time. Sequential reading is then repeated but with blocks selected randomly from the four files. Finally, each block from one file is read repetitively, normally involving data cached in main memory. Speed is measured in MB/second. Graphics GPU Power Test - The test uses options available in my CUDA benchmark for GeForce graphics, carrying out floating point calculations at high speed. Graphics Display Test - the range of display functions vary from simple coloured objects to a complex kitchen design application, produced using OpenGL Besides having options to select which function to run and running time, window size can also be specified and that can cover multiple screens. Note, for Linux, approval was given to Canonical to include this benchmark in the testing framework for the Unity desktop.
In the late 1960s, I was head of the section, with up to 20 staff, responsible for designing and supervising acceptance trials of all UK Government purchased computers, including those centrally funded for universities, and personally handling those for the largest systems. Then, the tests mainly involved running engineering diagnostics, with limited user applications for scientific systems. The diagnostics were mainly functional tests, and user programs produced vast amounts of printed output. At that time, our Software Branch repeatedly asked “What are we going to do for testing these new Operating Systems?”, without any suggestions.
|
|
1. running time 2. which test or test functions to run 3. data size to test a particular cache or RAM in memory tests 4. different log files for running multiple copies of a program concurrently 5. interval for displaying and logging intermediate results |
On modern systems, including PCs, tablets and smartphones, it can be useful to run stress testing programs to help to identify the reason for such as system failures or slow performance, with the most significant problems being heat related. On older systems, overheating tended to produce application or system failures. This can still apply on modern computers, but current designs incorporate facilities to avoid overheating by reducing the controlling clock speeds. Then failures can be avoided but, without warning, the systems might be running at half speed or less.
Then we have the battery powered devices where, again without warning, run slower as the battery discharges. Also there can be reliance on power saving options that only use maximum power, and introduce running at full speed, when really needed. This appears to be influenced by the controlling Operating Systems, that do not always control the functions correctly. An example in this report is the case where initial speed was slow when using a single processor core, but operated at maximum speed when a program was using multiple cores.
Below are details of a series of stress tests that cover processor integer and floating point calculations, cache and memory speeds, disk and other drives, including local network traffic, and graphics hardware. The programs can either be run standalone or multiple copies of any at the same time. Some detailed results are provided plus reference to more comprehensive reports. Links to download the test programs is provided, also the source code for those who wish to compile them for other systems or modify them for other purposes [No restrictions except use of existing or modified codes is at your own risk].
DOS and Windows PC CPU Tests
The first stress tests produced for PCs were based on the acceptance test programs that were most successful in identifying faults. The best one for identifying intermittent CPU failures was FOPR02. This carries out the binomial expansion, then summation, of (p + q) ^ n, where p + q = 1.0, with numerous variations in the variables and multiplying each summation together, to produce a final result close to 1.0. With fixed parameters, the final result of different runs should be identical.
Then there was FOPR04, carrying out similar calculations, with an visibly obvious sumcheck, via various mathematical functions, next most effective CPU test, that also identified questions of different compilers, or CPU hardware, not producing identical results of calculations.
CPR4DOS.EXE was my first CPU stress test that included the binomial calculations with those from FOPR04, to run via DOS. This is available in DOSTests.zip.
An example of results is below. Firstly, there is a run using fixed numbers of passes, with example sumchecks from early CPUs, showing some differences between 80486DX2 and Pentium calculations.
Next, the required minimum running time has to be entered. Verified results are then displayed and logged, for each pass, also running time difference as a guide to constant performance.
FPtest.exe, a real Windows version, was produced later and is available in burn9xnt.zip. The execution window has text entry boxes for minimum seconds per test (comprising multiple passes of initial run) and minimum repeat minutes.
An example of logged results is below (next page). Intermediate results are also displayed, at a slow flashing rate. Again note different sumchecks on the quoted PCs.
A second set of results is also provided, to show that the program still runs on a more modern PC, with a Core i7 CPU and Windows 10, where sumchecks are the same as from an old Pentium processor.
The benchmarks can also be run from a command prompt, where an extra parameter is available to specify the log file name, enabling multiple copies to be run.
 ########################## DOS Version ##########################

    PR04 C++ Functions Test Copyright © Roy Longbottom 1997

 Based on FOPR04 a TSU Acceptance Trials Program from another era

                                                 Example Sumcheck
                                                Pentium    80486DX2
 Functions         Answer           Sumcheck

 Sin, Cos    0.99999999999445120     -5532       -5532      -5532
 Exp, Tanh   1.00000000000012900      5776        5776       5776
 Log, Exp    0.99999999999111260     -6174       -6174      -6789
 Log10, Sqrt 1.00000000000002800      3440        3440       4263
 Complex     0.99996001225587480      5038        5038       4551
 Imag, Real  1.00000000000051100      4756        4756       4756
 Max, Min    0.99999999999253160     -6210       -6210      -6210
 Atan, Fmod  0.99999999999363160     -5941       -5941      -5508
 Binomial    1.00000000000094100      4574        4574       4574

 Time taken    83.70 seconds

 Start at Thu Mar 20 09:30:25 1997
 End   at Thu Mar 20 09:31:49 1997

 Enter minimum run time minutes to check for consistent results 1


 Extra pass 1 of 1

 Functions         Answer           Sumcheck

 Sin, Cos    0.99999999999445120     -5532        Result OK
 Exp, Tanh   1.00000000000012900      5776        Result OK
 Log, Exp    0.99999999999111260     -6174        Result OK
 Log10, Sqrt 1.00000000000002800      3440        Result OK
 Complex     0.99996001225587480      5038        Result OK
 Imag, Real  1.00000000000051100      4756        Result OK
 Max, Min    0.99999999999253160     -6210        Result OK
 Atan, Fmod  0.99999999999363160     -5941        Result OK
 Binomial    1.00000000000094100      4574        Result OK

 Time taken    84.10 seconds       0.48 seconds difference from first run

 Start at Thu Mar 20 09:32:30 1997
 End   at Thu Mar 20 09:33:54 1997


 ************************* 0 errors so far (see output file C092417.TXT)

 Finished

                 Windows Version on Next Page


 ######################## Windows Version ########################

    Floating Point Reliability Test Version 2.0 by Roy Longbottom

 Windows NT Version 5.0, build 2195,
 CPU AuthenticAMD Features Code 0183F9FF Model Code 00000630 950 MHz

 Minimum 10 seconds per test and 5 minutes repeating tests

              Start of test Sat Oct  6 14:49:30 2001

                                               Example Sumcheck
 Functions         Answer         Sumcheck  Athlon Pentium   80486

 Sin, Cos    1.00000000000000000        10      10      10      10
 Exp, Tanh   1.00000000000002300      5681    5681    3697    4306
 Log, Exp    1.00000000000305200      4346    4346    4508    4346
 Log10, Sqrt 1.00000000000036600      5501    5501    4132    4680
 Complex     0.99999600112830790      4976    4976    4976    4549
 Imag, Real  1.00000000000005100      4258    4258    4258    4258
 Max, Min    0.99999999999253160      5305    5305    5305    5305
 Atan, Fmod  0.99999999999165060      6533    6533    5131    6063
 Binomial    0.99999999998445720      5881    5881    5881    5881

 Time taken for one pass     1.87 seconds

 First tests SUMCHECKS same as Athlon

 Repeat tests

 123456789 Sat Oct  6 14:52:33 2001
 123456789 Sat Oct  6 14:54:04 2001
 123456789 Sat Oct  6 14:55:35 2001
 123456789 Sat Oct  6 14:57:06 2001

 Repeat tests time taken     6.08 minutes, 4 repeats

 Consistent results obtained in passes of repeat tests

                End of test Sat Oct  6 14:56:06 2001

 ###################### Windows 10 Results ######################

   Floating Point Reliability Test Version 2.0 by Roy Longbottom

 Windows NT Version 6.2, build 9200,
 CPU GenuineIntel, Features Code BFEBFBFF, Model Code 000306E4, 3711 MHz

 Minimum 10 seconds per test and 5 minutes repeating tests

              Start of test Tue Nov 28 12:02:03 2017

                                               Example Sumcheck
 Functions         Answer         Sumcheck  Athlon Pentium   80486

 Sin, Cos    1.00000000000000000        10      10      10      10
 Exp, Tanh   1.00000000000002400      3697    5681    3697    4306
 Log, Exp    1.00000000000305100      4508    4346    4508    4346
 Log10, Sqrt 1.00000000000035700      4132    5501    4132    4680
 Complex     0.99999600112830790      4976    4976    4976    4549
 Imag, Real  1.00000000000005100      4258    4258    4258    4258
 Max, Min    0.99999999999253160      5305    5305    5305    5305
 Atan, Fmod  0.99999999999165030      5131    6533    5131    6063
 Binomial    0.99999999998445720      5881    5881    5881    5881

 Time taken for one pass     0.51 seconds

 First tests SUMCHECKS same as Pentium

 Repeat tests

 123456789 Tue Nov 28 12:03:34 2017
 123456789 Tue Nov 28 12:05:04 2017
 123456789 Tue Nov 28 12:06:34 2017
 123456789 Tue Nov 28 12:08:04 2017

 Repeat tests time taken     6.01 minutes, 4 repeats

 Consistent results obtained in passes of repeat tests

                End of test Tue Nov 28 12:08:04 2017
|
DOS and Windows PC Drive Tests
The disk test is based on FODK01, used in acceptance trials, that wrote up to ten files, then read blocks from the files in random order. Each data block written comprised a particular binary pattern, intended to identify pattern conscious faults. The random reading order was restricted to a predetermined sequence. Besides inducing normal disk drive problems, this program identified two major design problems. The first was on a large IBM mainframe, with an early version of the MVT Operating System, where the the random access procedure could read data from the the wrong file. The second was on a CDC CYBER 205 supercomputer, where the data patterns were corrupted on the disk bus.
CDK1DOS.EXE writes four files, each of a minimum size of about 10 Mbytes. Block size is 64 KB and a different data pattern is written to 164 blocks. The files are then read sequentially twice and data compared with the appropriate pattern. Some random access is induced in one pass via reading the same block from the four files in a different sequence but the disk might minimise this via its buffer. Next each block is read a number of times where they likely to remain in the buffer and be read at maximum DMA speeds. This is also in DosTests.zip, that includes a more detailed description.
DiskTest.exe, the full Windows version, in burn9xnt.zip, writes four files using different data patterns for each block. The files are then read and data checked for a chosen time. The files are each read sequentially then all four sequentially but the blocks being selected from files randomly. Finally, each block from one file is read repetitively where the data will probably reside in the disk's buffer and reading will be at DMA speeds. The run time window has data entry boxes for file size, reading minutes and DMA seconds for each of 164 data patterns.
The benchmarks can be run from a command line, with an extra parameter for log file name, allowing multiple copies to be run (see ZIP files). They can also be executed from a remote local network system, to provide a network test.
Below are generated data patterns and reading sequences, plus example DOS and Windows log files (20 years apart).
 ######################## Data Patterns and Reading Sequence ########################

No.  Pattern       Or No.   Pattern       Or  No.   Pattern       Or  No.    Pattern       Or
 1         0        0  2          1        1  83         -1 ffffffff  84          -2 fffffffe
 3         2        2  4          4        4  85         -3 fffffffd  86          -5 fffffffb
 5         8        8  6         16       10  87         -9 fffffff7  88         -17 ffffffef
 7        32       20  8         64       40  89        -33 ffffffdf  90         -65 ffffffbf
 9       128       80 10        256      100  91       -129 ffffff7f  92        -257 fffffeff
11       512      200 12       1024      400  93       -513 fffffdff  94       -1025 fffffbff
13      2048      800 14       4096     1000  95      -2049 fffff7ff  96       -4097 ffffefff
15      8192     2000 16      16384     4000  97      -8193 ffffdfff  98      -16385 ffffbfff
17     32768     8000 18      65536    10000  99     -32769 ffff7fff 100      -65537 fffeffff
19    131072    20000 20     262144    40000 101    -131073 fffdffff 102     -262145 fffbffff
21    524288    80000 22    1048576   100000 103    -524289 fff7ffff 104    -1048577 ffefffff
23   2097152   200000 24    4194304   400000 105   -2097153 ffdfffff 106    -4194305 ffbfffff
25   8388608   800000 26   16777216  1000000 107   -8388609 ff7fffff 108   -16777217 feffffff
27  33554432  2000000 28   67108864  4000000 109  -33554433 fdffffff 110   -67108865 fbffffff
29 134217728  8000000 30  268435456 10000000 111 -134217729 f7ffffff 112  -268435457 efffffff
31 536870912 20000000 32 1073741824 40000000 113 -536870913 dfffffff 114 -1073741825 bfffffff
33         1        1 34          5        5 115         -2 fffffffe 116          -6 fffffffa
35        21       15 36         85       55 117        -22 ffffffea 118         -86 ffffffaa
37       341      155 38       1365      555 119       -342 fffffeaa 120       -1366 fffffaaa
39      5461     1555 40      21845     5555 121      -5462 ffffeaaa 122      -21846 ffffaaaa
41     87381    15555 42     349525    55555 123     -87382 fffeaaaa 124     -349526 fffaaaaa
43   1398101   155555 44    5592405   555555 125   -1398102 ffeaaaaa 126    -5592406 ffaaaaaa
45  22369621  1555555 46   89478485  5555555 127  -22369622 feaaaaaa 128   -89478486 faaaaaaa
47 357913941 15555555 48 1431655765 55555555 129 -357913942 eaaaaaaa 130 -1431655766 aaaaaaaa
49         3        3 50         51       33 131         -4 fffffffc 132         -52 ffffffcc
51       819      333 52      13107     3333 133       -820 fffffccc 134      -13108 ffffcccc
53    209715    33333 54    3355443   333333 135    -209716 fffccccc 136    -3355444 ffcccccc
55  53687091  3333333 56  858993459 33333333 137  -53687092 fccccccc 138  -858993460 cccccccc
57         7        7 58        455      1c7 139         -8 fffffff8 140        -456 fffffe38
59     29127     71c7 60    1864135   1c71c7 141     -29128 ffff8e38 142    -1864136 ffe38e38
61 119304647  71c71c7 62         15        f 143 -119304648 f8e38e38 144         -16 fffffff0
63      3855      f0f 64     986895    f0f0f 145      -3856 fffff0f0 146     -986896 fff0f0f0
65 252645135  f0f0f0f 66         31       1f 147 -252645136 f0f0f0f0 148         -32 ffffffe0
67     31775     7c1f 68   32537631  1f07c1f 149     -31776 ffff83e0 150   -32537632 fe0f83e0
69        63       3f 70     258111    3f03f 151        -64 ffffffc0 152     -258112 fffc0fc0
71       127       7f 72    2080895   1fc07f 153       -128 ffffff80 154    -2080896 ffe03f80
73       255       ff 74   16711935   ff00ff 155       -256 ffffff00 156   -16711936 ff00ff00
75       511      1ff 76       1023      3ff 157       -512 fffffe00 158       -1024 fffffc00
77      2047      7ff 78       4095      fff 159      -2048 fffff800 160       -4096 fffff000
79      8191     1fff 80      16383     3fff 161      -8192 ffffe000 162      -16384 ffffc000
81     32767     7fff 82      65535     ffff 163     -32768 ffff8000 164      -65536 ffff0000

              Sequences    File           Sequences    File

                  1        0  1  2  3        11        2  1  0  3
                  2        1  2  3  0        12        3  2  1  0
                  3        2  3  0  1        13        0  1  2  3
                  4        3  0  2  1        14        1  2  3  0
                  5        0  2  1  3        15        2  3  0  1
                  6        1  3  2  0        16        3  0  2  1
                  7        2  0  1  3        17        0  2  1  3
                  8        3  1  2  0        18        1  3  2  0
                  9        0  3  1  2        19        2  0  1  3
                 10        1  0  3  2        20        3  1  2  0

                       Example Results on Next Page


                          Example Results

 ########################## DOS Version ##########################

    Disk test dk01 in C++ by Roy Longbottom  Job D110732Z

    Disk C Free disk space   1164.3 Mbytes will use     28.2

     0.22 seconds for data generation and display

    File writing starting on Tue Mar 18 11:07:50 1997

     4 files written each 7389184 bytes (data*22)

     8.57 seconds writing files at     3.29 MB/sec Tue Mar 18 11:07:59 1997

    39.67 seconds read pass   1 at     0.71 MB/sec Tue Mar 18 11:08:39 1997
    50.15 seconds read pass   2 at     0.56 MB/sec Tue Mar 18 11:09:30 1997
    66.58 seconds read pass   3 at     0.42 MB/sec Tue Mar 18 11:10:37 1997
    46.51 seconds read pass   4 at     0.61 MB/sec Tue Mar 18 11:11:23 1997

      Finished Files Erased on Tue Mar 18 11:11:23 1997

 ######################## Windows Version ########################

                             Commands

  DiskTest A[uto], M[B] bbbbb, R[dmin] mmmm, D[MAsec] sssss, [L]og tttt.txt

  Auto runs the program, logs the results and exits automatically
  bbbbb is MB per file - rounded up to multiples of 10.3 MB
  mmmm is file reading time in minutes
  sssss is seconds that each DMA run of 164 tests is repeated
  tttt.txt is log file name, useful if multiple copies run

   DiskTest Auto, MB 10, Rmin 1, DMAsecs 1, Log BatLog.txt

     Disk Reliability Test Version 2.0 by Roy Longbottom

 Windows NT Version 6.2, build 9200,
 CPU GenuineIntel, Features Code BFEBFBFF, Model Code 000306E4, 3711 MHz
 From GlobalMemoryStatus: Size 2097151 KB, Free 2097151 KB
 Disk/partition 266239 MB, Free 128830 MB

 File size    10.3 MB x 4 files, minimum reading time 1 minutes

              Start of test Tue Nov 28 21:44:42 2017

 File 1    10.3 MB written in    0.30 seconds
 File 2    10.3 MB written in    0.27 seconds
 File 3    10.3 MB written in    0.31 seconds
 File 4    10.3 MB written in    0.28 seconds

              Start reading Tue Nov 28 21:44:43 2017

 Reading     168 x    10.3 MB in     1.00 minutes

 42 read passes, 4 Files of    10.3 MB in     1.00 minutes

            Start Repeat Read Tue Nov 28 21:45:43 2017

 Passes in 1 second(s) for each of 164 blocks of 64KB:

   500   560   560   560   560   560   560   520   540   560   560   540
   520   540   540   560   560   520   460   520   520   560   540   560
   580   580   560   500   500   520   560   560   560   560   580   580
   580   560   520   560   540   540   560   520   520   540   560   560
   560   560   560   560   560   560   540   500   560   580   580   540
   580   560   540   500   560   540   520   560   520   560   580   580
   480   500   520   560   540   580   540   540   580   580   540   580
   580   560   560   560   560   540   560   500   520   580   540   560
   560   560   560   560   560   540   580   580   560   500   520   560
   560   560   560   540   560   540   540   520   540   560   560   560
   560   520   540   500   560   580   580   540   480   560   520   500
   560   560   540   560   580   520   520   580   560   500   560   560
   560   580   560   580   600   540   500   560   560   540   560   560
   500   520   560   500   560   560   560   500

 89840 read passes of 64KB blocks in     2.79 minutes

  No errors found during reading tests

                End of test Tue Nov 28 21:48:41 2017
|
Livermore Loops Benchmark
Details and results of this benchmark can be found in
livermore loops results.htm.
In its original form, it was found to produce the wrong results of numeric calculations on an overclocked PC.
This lead to additional run time parameters being added to enable the program to be used as a stress test. Both 32 bit and 64 bit versions for Windows are included in
win64.zip
with source code from
newsource.zip.
There are 24 Livermore Loops (kernels of numerical application) that are run three times with different data sizes. For a stress test a number, representing the running time of each loop, has to be added to the execution command (example lloops64.exe secs 5). For 5 seconds per loop, running time of 72 would be expected to be around 6 minutes. Further details can be found in burnin4cpu.htm.
The output of the stress test is indicated below, the three sections are displayed and checksum verified, with errors saved in the log file. The checksums can be different when the benchmark is produced by alternative compilers, but the displayed errors can be used to produce an alternative set of numbers to check. With no errors, the log file entries are as shown below.
Display as tests are running Kernel Floating Pt ops No Passes E No Total Secs. MFLOPS Span Checksums OK ------------ -- ------------- ----- ------- ---- ---------------------- -- 1 28 x2148 5 1.299110e+010 4.98 2606.36 27 3.855104502494961e+001 16 2 46 x2541 4 8.228774e+009 5.04 1633.72 15 3.953296986903060e+001 16 3 37 x1949 2 6.230563e+009 5.03 1239.56 27 2.699309089320672e-001 16 4 38 x1943 2 3.544032e+009 5.00 709.31 27 5.999250595473891e-001 16 5 40 x 515 2 1.713920e+009 5.01 342.30 27 3.182615248447483e+000 16 6 21 x1610 2 2.596608e+009 5.02 517.20 8 1.120309393467088e+000 15 7 20 x1455 16 1.564416e+010 5.02 3113.69 21 2.845720217644024e+001 16 8 9 x1084 36 1.461059e+010 5.10 2862.39 14 2.960543667875005e+003 15 9 26 x1193 17 1.265534e+010 5.02 2522.64 15 2.623968460874251e+003 16 To 24 three times Log File Reliability test 5 seconds each loop x 24 x 3 Part 1 of 3 start at Tue Apr 5 12:53:14 2011 Part 2 of 3 start at Tue Apr 5 12:55:11 2011 Part 3 of 3 start at Tue Apr 5 12:57:11 2011 Numeric results were as expected |
Windows Integer Stress Tests
BusSpeed reliability test is run using BusSpd2k.exe benchmark that can be found in
busspd2k.zip.
The program can be run by entering details in the test window for data size, in KB, to suit caches or RAM, and seconds to run each test, of 12 for the later version. Alternatively, it can be run via BAT files, examples of which are in the ZIP file. This has an additional parameter for the log file name, to allow multiple copies of the program to be run.
Further details are provided in
burnin32.htm.
The program uses assembly code and eight 64 bit MMX registers. The original version had six tests to write and read the data multiple times, with a different data pattern for each test. For every other pass, an inverse binary pattern is used (e.g. repeated hex A5 and 5A). A later version included six additional read only tests. Reading involves adding and subtracting, where the final result should be the same as the original. This is checked after multiple passes and the first few wrong results reported for each pattern. The aim is to produce maximum data transfer and calculation speeds.
Note MB/second for the first tests is for writing and reading, where bus data traffic would be twice that.
Below are examples of results of versions 1 and 2, from the same system. I Think that it was overclocked and that was responsible for the identified failures.
IntBurn64.exe has the same Windows interface as the reliability section for BusSpd2k and, essentially, the same C/C++ code, but assembly code operating on normal 64 bit registers. The benchmark and source codes can be found in more64bit.zip, with further details and results in burnin64.htm. Along with other stress testing programs, IntBurn64 can be used for a memory paging stest. See: paging.htm.
The logged output from IntBurn64 is the same as that from BusSpd2k stress test function, with an additional indication of maximum processing speed in MIPS, derived from the known instruction count in the assembly code used. The program also has a run time command parameter to define four different screen positions for main windows, enabling clear display of multiprocessor activity. For more details see the next page.
None of the HTM reports, for these integer Windows benchmarks, identified particularly high temperatures. but see
Linux tests
below. However, they did identify some problems, including a memory fault, where the often recommended Memtest86 failed to identify it, after running for hours. For this particular fault, I came to the conclusion that my tests were transferring data at a much faster speed, probably as data comparisons are carried out after numerous calculations.
 #########################################################################

             BusSpd2k RAM Reliability Test Version 1

  1    960 MB/sec  Pattern 0000000000000000 	 Result OK        2 passes
  2    930 MB/sec  Pattern FFFFFFFFFFFFFFFF 	 Result OK        2 passes
  3    965 MB/sec  Pattern A5A5A5A5A5A5A5A5 	 Result OK        2 passes
  4    964 MB/sec  Pattern 5555555555555555 	 Result OK        2 passes
  5    963 MB/sec  Pattern 3333333333333333 	 Result OK        2 passes
  6    963 MB/sec  Pattern F0F0F0F0F0F0F0F0 	 Result OK        2 passes

                       Example Errors

  1    966 MB/sec  Pattern 0000000000000000 	 Result OK        2 passes
  2    925 MB/sec  Pattern FFFFFFFFFFFFFFFF 	 Result OK        2 passes
  3    963 MB/sec  Pattern A5A5A5A5A5A5A5A5 	 Result OK        2 passes

    ERROR found checking data after generation - Test 4
    147456K 4 byte words checked and 16 errors found
    First 12 errors
    Pattern 55555555 Was 555555A5 Word 57358593
    11 More (not shown here)

 #########################################################################

             BusSpd2k L1 Cache Reliability Test Version 2

 Write/Read
  1   2046 MB/sec  Pattern 0000000000000000 	 Result OK  1248737 passes
  2   2052 MB/sec  Pattern FFFFFFFFFFFFFFFF 	 Result OK  1252555 passes
  3   2055 MB/sec  Pattern A5A5A5A5A5A5A5A5 	 Result OK  1254052 passes
  4   2053 MB/sec  Pattern 5555555555555555 	 Result OK  1253050 passes
  5   2054 MB/sec  Pattern 3333333333333333 	 Result OK  1253647 passes
  6   2052 MB/sec  Pattern F0F0F0F0F0F0F0F0 	 Result OK  1252231 passes
 Read
  1   7345 MB/sec  Pattern CCCCCCCCCCCCCCCC 	 Result OK  8966800 passes
  2   7340 MB/sec  Pattern 0F0F0F0F0F0F0F0F 	 Result OK  8959600 passes
  3   7343 MB/sec  Pattern A5A5A5A5A5A5A5A5 	 Result OK  8964300 passes
  4   7340 MB/sec  Pattern 5555555555555555 	 Result OK  8960700 passes
  5   7347 MB/sec  Pattern 3333333333333333 	 Result OK  8968400 passes
  6   7340 MB/sec  Pattern F0F0F0F0F0F0F0F0 	 Result OK  8960400 passes

                Example Errors - slow speed, overheating?
 Write/Read
  1   2051 MB/sec  Pattern 0000000000000000 	 Result OK   250363 passes
  2    666 MB/sec  Pattern FFFFFFFFFFFFFFFF | ERROR
 1K 4 byte words checked and 1 errors found
 1 errors
 Pattern FFFFFFFF Was 00000000 Word 14
|
Windows Multiprocessor Integer Stress Tests
Details of multiprocessor stress tests can be found in
dualcore.htm,
burnin4cpu.htm
and
quad core 8 thread.htm.
Following are some results that suggest tests that might be required, to produce maximum stress on a modern system. These relate to a quad core CPU with hyperthreading (identified as 8 cores), plus four channel high speed RAM. Firstly, an example of commands to run four IntBurn64 tests concurrently, then an example of logged data for one test.
 #########################################################################

              Example BAT file commands to test four CPUs:

Start IntBurn64 KB 100000, Secs 5, auto, P1, Log ITestx1.txt
Start IntBurn64 KB 100000, Secs 5, auto, P2, Log ITestx2.txt
Start IntBurn64 KB 100000, Secs 5, auto, P3, Log ITestx3.txt
Start IntBurn64 KB 100000, Secs 5, auto, P4, Log ITestx4.txt

 #########################################################################

   Single 100 MB Memory Test, average GB/second 12.3 Write/Read 16.8 Read

          64 Bit Integer Reliability Test Version 1.2 for 64 bit OS

  Test 100000 KB at 5 seconds per test, Start at Fri Dec 01 16:59:41 2017

  Write/Read
  1   12101 MB/sec  Pattern 0000000000000000 	 Result OK       299 passes
  2   12294 MB/sec  Pattern 0000000000000000 	 Result OK       304 passes
  3   12300 MB/sec  Pattern A5A5A5A5A5A5A5A5 	 Result OK       305 passes
  4   12298 MB/sec  Pattern 5555555555555555 	 Result OK       305 passes
  5   12295 MB/sec  Pattern CCCCCCCCCCCCCCCC 	 Result OK       304 passes
  6   12295 MB/sec  Pattern 0F0F0F0F0F0F0F0F 	 Result OK       304 passes
 Max   2595 64 bit MIPS
 Read
  1   16818 MB/sec  Pattern 0000000000000000 	 Result OK       880 passes
  2   16815 MB/sec  Pattern FFFFFFFFFFFFFFFF 	 Result OK       880 passes
  3   16804 MB/sec  Pattern A5A5A5A5A5A5A5A5 	 Result OK       880 passes
  4   16690 MB/sec  Pattern 5555555555555555 	 Result OK       825 passes
  5   16726 MB/sec  Pattern 3333333333333333 	 Result OK       880 passes
  6   16808 MB/sec  Pattern F0F0F0F0F0F0F0F0 	 Result OK       880 passes
 Max   2496 64 bit MIPS

 Minimum seconds - generate/check data   0.0165363, compare   0.0073533

             Reliability Test Ended Fri Dec 01 17:00:44 2017

 #########################################################################

           Quad Core 8 Thread 3.7 GHz, Turbo 3.9 GHz, Core i7 CPU
                 4 Channel RAM Maximum Speed 51.2 GB/second

                      Four 100 MB Memory Tests

                  1       2       3       4     All  1 Test    Gain

R/W MIPS       1418    1442    1501    1441    5802    2595    2.24
R/W MB/s       6637    6734    9973    6698   30041   12264    2.45

Rd MIPS        1499    1501    1503    1475    5978    2496    2.40
Rd MB/s        9934    9973   10037    9871   39815   16777    2.37


     CPU MIPS for One, Four and Eight CPU Tests at 8 KB L1 Cache Size

              1      2      3      4      5      6      7      8  Total   Gain
Tests

  1  R/W   5682                                                    5682
      Rd   6096                                                    6096

  4  R/W   5471   5465   5542   5597                              22075   3.89
      Rd   5681   5918   5708   6052                              23359   3.83

  8  R/W   3665   3675   3668   3591   3665   3611   3667   3652  29194   5.14
      Rd   3306   3346   3323   3413   3356   3549   3373   3330  26996   4.43
|
Windows Floating Point Stress Tests
SSE3DSoak.exe uses assembly code SSE, SSE2 or 3DNow Single Instruction Multiple Data (SIMD) floating point instructions to soak test the CPU, Cache or RAM at high speeds whilst checking results for correct values. SSE, SSE2 and 3DNow Run buttons are provided for separate CPU, Cache and RAM tests.
The program produces 1024 random floating point numbers used in all tests. For the CPU test, 32 add or multiply instructions manipulate a few at a time from registers within a loop. The Cache test uses the same 32 instructions but with data from L1 cache within the main loop. The RAM test is biased towards fast data transfer and can also use cache sized data. Every fifth pass the memory is filled with 16 or 32 of the random numbers with the first set being read and checked for correctness. The main loop uses 8 load/add and 8 load/subtract instructions to produce a sum check of zero. CPU and Cache tests check that results are the same as the first pass which also calibrates the testing loops to run for up to one second (on a fast CPU).
Drop down lists are provided to select running time (1 minute to 24 hours), and memory size used, between 4 KB and 4 MB for cache tests and 4 KB to 1024 MB for RAM tests (to test using data in L1 cache, L2 cache or RAM). An example of the log file is shown below. Further details can be found in burnin32.htm with the benchmark and source code in sse3dnow.zip.
SSEburn64.exe uses the same Windows test panel and assembly code instructions as SSE3DSoak, excluding AMD 3DNow functions, and compiled for 64 bit operation. The program code and execution file are in more64bit.zip. Below is an example of commands to run four copies of the benchmark at the same time, followed by performance details using one and four CPUs. More information and results are provided in burnin64.htm. See Linux tests for details of excessive CPU temperatures whilst running stress tests. Below is an example of what might be expected on a PC, running SSEburn64, in good working condition and in a cool environment (quad core 3 GHz Phenom II - measurement does not represent an actual temperature but is a relative reading that can be used for thermal management, with a maximum value is 70°C).
 ##############################################################################

   SSE CPU Test at 5 minutes Example Log File

    1.01 Minutes at 14558 MFLOPS, No Errors
    2.00 Minutes at 14754 MFLOPS, No Errors
    3.01 Minutes at 14821 MFLOPS, No Errors
    4.00 Minutes at 14854 MFLOPS, No Errors
    5.01 Minutes at 14874 MFLOPS, No Errors

 ##############################################################################

              3.9 GHz Core i7 Example BAT File Commands

 Start SSEBurn64 SSE, Cache, KB 128, Mins 5, auto, P1, Log Testx1.txt
 Start SSEBurn64 SSE, Cache, KB 128, Mins 5, auto, P2, Log Testx2.txt
 Start SSEBurn64 SSE, Cache, KB 128, Mins 5, auto, P3, Log Testx3.txt
 Start SSEBurn64 SSE, Cache, KB 128, Mins 5, auto, P4, Log Testx4.txt

 ##############################################################################

                      L1        L2        L3        L3       RAM       RAM
                                      Wrt/Rd      Read    Wrt/Rd      Read
                    4 KB    128 KB      2 MB      2 MB     64 MB     64 MB
           CPU     Cache     Cache    Memory    Memory    Memory    Memory
        MFLOPS    MFLOPS    MFLOPS    MB/sec    MB/sec    MB/sec    MB/sec

 SSE     14558     23217     23290     18894     34158     13286     18950
 SSE2     7485     11462     11618     20294     34158

 SSE CP1           21962                9162     29771      7291     11566
 SSE CP2           29771                2783     29452      7033     11619
 SSE CP3           22040                5003     30301      7371     10032
 SSE CP4           21766               10432     29817      7074     10683

 Total 4 CPUs      95539               27380    119341     28769     43900
 Performance Gain   4.12                1.45      3.49      2.17      2.32
|
Windows Graphics Stress Tests
CUDA MFLOPS - CUDA, from nVidia, provides programming functions to use GeForce graphics processors for general purpose computing. It can produce outstanding speeds in MFLOPS, as demonstrated by my benchmarks, described in my
CUDA.htm MFLOPS Benchmarks
report, that also contain results. The benchmarks have run time parameters that determine which test to run, number of threads to use, testing duration in minutes and reporting rate in seconds. Examples of running the single and double precision versions are in cuda1.htm and cuda2.htm respectively. The benchmarks and source codes are in
gigaflops-benchmarks.zip.
Below is an example of results on a PC with a Phenom II X4 3.0 GHz CPU, 64-Bit Windows 7 and a GeForce GTS 250 graphics card,
from a near ten minute test, where GPU temperature was noted.
Here, performance was constant, over the period, with up to a 30°C temperature increase.
  CUDA MFLOPS Benchmark 1.1 Mon Nov 09 11:11:31 2009

  CUDA devices found
  Device 0: GeForce GTS 250  with 16 Processors 128 cores

  Using 256 Threads

  Calculate      Reliability Test 10 minutes, report every 15 seconds

  Repeat CUDA 761 times at  1.52 seconds. Repeat former 9 times

  Results of all calculations should be 0.741250

  Test  4 Byte  Ops/   Repeat  Seconds   MFLOPS    Errors     First      Value
         Words  Word   Passes                                  Word

   1  10000000    32     6849   13.736   159563   None found
   2  10000000    32     6849   13.732   159605   None found
   3  10000000    32     6849   13.730   159623   None found
   4  10000000    32     6849   13.730   159629   None found
   5  10000000    32     6849   13.734   159575   None found
   6  10000000    32     6849   13.732   159607   None found
  to
  40  10000000    32     6849   13.753   159362   None found

  Minutes          0  0.5  1.0  1.5  2.0  3.0  4.0  5.0  6.0  7.0  8.0  9.0
  Temperature °C  42   59   63   67   69   71   71   72   72   71   70   71
|
VideoD3D9 Benchmark has run time parameters, enabling it to be used as a stress test, with 64 bit and 32 bit versions available. Details of VideoD3D9_64, VideoD3D9_32 are provided in Graphics Benchmarks.htm and can be downloaded in Windows-Graphics-Benchmarks.zip.
Below are commands to run SSEBurn64 and VideoD3D9_64 in stress testing mode, followed by example results, reported at intervals of around 1 minute. An example of CPU and GPU temperatures obtained are provided in
burnin64.htm,
along with other details and test results.
Commands Start SSEBurn64 SSE2, Cache, KB 4, Mins 10, auto, P3, Log T11.txt Start VideoD3D9_64 Auto, Test 6, Width 640, Height 480, P1, Secs 600, Log T21.txt SSE2 Cache Test Results DirectX9 D3D Test Results 1.00 Minutes at 2174 MFLOPS, No Errors 665.9 Frames Per Second over 60 seconds 2.01 Minutes at 2189 MFLOPS, No Errors 653.4 Frames Per Second over 60 seconds 3.00 Minutes at 2195 MFLOPS, No Errors 651.1 Frames Per Second over 60 seconds 4.00 Minutes at 2197 MFLOPS, No Errors 650.6 Frames Per Second over 60 seconds 5.00 Minutes at 2199 MFLOPS, No Errors 651.6 Frames Per Second over 60 seconds 6.01 Minutes at 2199 MFLOPS, No Errors 652.5 Frames Per Second over 60 seconds 7.02 Minutes at 2201 MFLOPS, No Errors 648.0 Frames Per Second over 60 seconds 8.01 Minutes at 2180 MFLOPS, No Errors 740.0 Frames Per Second over 60 seconds 9.00 Minutes at 2164 MFLOPS, No Errors 744.1 Frames Per Second over 60 seconds 10.00 Minutes at 2152 MFLOPS, No Error 680.3 Frames Per Second Overall |
Linux Versions
Most of the benchmarks and source codes for 32 bit and 64 bit compilations are available in
linux_burn-in_apps.tar.gz,
with more details and results in
linux burn-in apps.htm.
These are all run from Terminal commands or shell scripts.
PC Drive Tests - drivestress32 and drivestress64
{See). Run time commands are somewhat dufferent to the Windows version, as shown below.
L - log file number N for IOStressN.txt M - Minutes to read all files S - Seconds to read each block of 1 file R - file size Repeat multiplier x 10.25 MB F - File path for drive or partition C - Use Linux RAM based File Cache Example: ./drivestress64 Log 0, Mins 2, Secs 1, Repeats 1, FilePath ~/all64/burndis |
Livermore Loops - lloops and lloops_64
(See).
An example command to define the running time of each of the 72 loops is ./lloops_64 secs 5.
Integer Stress Tests - intburn32 and intburn64 (See). An example of shell script cpmmands to run multiple copies is shown below. In this case (with Ubuntu), the commands can define terminal window sizes and position.
The linux burn-in apps.htm report includes results of Paging/Swapping Tests, where data transfer speed varied between 9 and 5000 MB/second.
Example Shell Script Commands xterm -geometry 80x25+10+10 -e ./intburn64 KBytes 4, Secs 5, Log 1 & xterm -geometry 80x25+600+10 -e ./intburn64 KBytes 4, Secs 5, Log 2 & xterm -geometry 80x25+10+500 -e ./intburn64 KBytes 4, Secs 5, Log 3 & xterm -geometry 80x25+600+500 -e ./intburn64 KBytes 4, Secs 5, Log 4 |
CUDA Graphics Stress Tests - cudamflops32SP and cudamflops64SP (See above) and CUDA.htm CUDA MFLOPS Benchmarks. Run time commands are somewhat different to the Windows version, as shown in linux burn-in apps.htm. The CUDA benchmark source codes can be found in linux_cuda_mflops.tar.gz. Below is an example of GPU temperature rises, running a CUDA and three CPU stress tests.
  Quad Core 3.0 GHz Phenom, GeForce GTS 250 running 3hree CPU tests plus

  CUDA command -  xterm -e ./cudamflops32SP Mins 10, FC

Minute 0      1      2      3      4      5      6      7      8      9     10   Rise
     ------------------------------------- °C  --------------------------------------

GPU   48     69     74     75     75     76     76     76     76     76     76     28
|
OpenGL Graphics Stress Tests - videogl32, videogl64 (See). - Benchmarks and source codes are in linux-graphics-benchmarks.tar.gz with more details in Graphics Benchmarks.htm and linux opengl benchmarks.htm. Following are details of a test on a CPU with Hyperthreading (4 core 8 threads), running videogl64 at the same time and 8 CPU stress tests.
Note, approval was given to Canonical to include this benchmark in the testing framework for the Unity desktop.
  Script for Core i7 3.7 to 3.9 GHz CPU, GeForce GTX 650

 ./burninsse64 KWords 5, Section 3, Minutes 10, Log 1, &
 ./burninsse64 KWords 5, Section 3, Minutes 10, Log 2, &
 ./burninsse64 KWords 5, Section 3, Minutes 10, Log 3, &
 ./burninsse64 KWords 5, Section 3, Minutes 10, Log 4, &
 ./intburn64 Log 5, KBytes 4, Seconds 50 &
 ./intburn64 Log 6, KBytes 4, Seconds 50 &
 ./intburn64 Log 7, KBytes 4, Seconds 50 &
 ./videogl64 Width 1920, Height 800, Mins 10, Test 4

                    Average MB/Second
                Stand Alone   Test Speed       Ratio

  burninsse64       23485        62789          2.67
  intburn64 Wr/Rd   25094        44420          1.77
  intburn64 Rd      40874        77916          1.91

  videogl64 FPS      1128          850          0.75

Minute 0      1      2      3      4      5      6      7      8      9     10   Rise
      ---------------------------------- °C  ----------------------------------------

CPU   30     54     58     61     62     62     62     62     62     62     62     32
GPU   30     42     45     46     47     48     48     48     48     49     50     20
|
Linux Floating Point Stress Tests
The 64 bit and 32 bit tests, burninsse32 and burninsse64, are based on the OpenMP benchmark described in
openmp mflops.htm,
where the program compiled without OpenMP directives ran very fast, due to the GCC compiler generating optimised code using SSE instructions. Here, the arithmetic operations executed are of the form x[i] = (x[i] + a) * b - (x[i] + c) * d + (x[i] + e) * f with 2, 8 or 32 operations per data word.
Below are details of run time parameters, a script to test 4 CPUs and results.
    Run Time Parameters

    S or Section 1, 2 or 3 for 2, 8 or 32 operations per word
    L or Logfile number N = 0 to 99 for name logN.txt
    K or KW or KWords cache or RAM data words used
    M or Minutes for running time

    Results are reported every 15 seconds

            Example Script to test four CPUs on 3.9 GHz Core i7

 xterm -geometry 80x25+10+10   -e ./burninsse64 KW 2, Section 3, Mins 1, Log 1 &
 xterm -geometry 80x25+600+10  -e ./burninsse64 KW 2, Section 3, Mins 1, Log 2 &
 xterm -geometry 80x25+10+500  -e ./burninsse64 KW 2, Section 3, Mins 1, Log 3 &
 xterm -geometry 80x25+600+500 -e ./burninsse64 KW 2, Section 3, Mins 1, Log 4

          Example Results for one test, others almost identical

   Pass    4 Byte  Ops/   Repeat    Seconds   MFLOPS          First   All
            Words  Word   Passes                            Results  Same

      1      2000    32  5487500      15.00    23410    0.352167547   Yes
      2      2000    32  5487500      15.00    23407    0.352167547   Yes
      3      2000    32  5487500      15.01    23404    0.352167547   Yes
      4      2000    32  5487500      15.01    23404    0.352167547   Yes
|
|
As reported in
linux burn-in apps.htm,
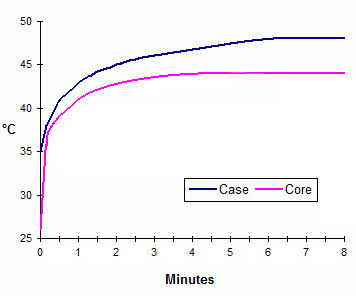
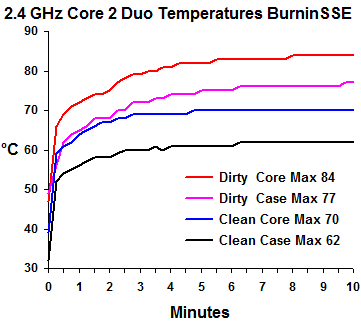
this test revealed a number of heat related problems. The first, reported here, was on a desktop PC, with a core 2 duo CPU, where CPU temperatures using Windows applications appeared to be high. This was confirmed by running burninsse32, although performance was not reduced over the test period. On opening the PC case, the CPU heatsink was found to be clogged up with dust. After blowing out the dust with a compressed air spray, the Linux tests were rerun and measured maximum temperatures were 14°C to 15°C lower, as shown on the right.
However, further tests revealed a problem associated with Ubuntu’s Frequency Scaling Monitor. When set as “On-Demand”, on running one copy, speed was reduced at the start, with CPU GHz indicated as 1.6. Yet, running with two copies, CPU MHz ran at 2.4 GHz continuously, with proportional increase in MFLOPS speed. |
 |
Anther problem was on a laptop, again with a Core 2 Duo PC. This overheated after booting, causing the CPU to run at less than half speed. Unlike using Windows, with power on to Ubuntu, initial CPU temperatures were high with the fan not appearing to run as fast as it might. On one occasion, the system turned off the power in the middle of a test. Sometimes the laptop started at a lower temperature and did not overheat, with the fan apparently running at high speed.
Below are speeds and recorded temperatures of tests using data from L1 and L2 caches, showing worse than half speed operation at high temperatures.
                                                    Later near constant speed higher °C rises
 Words  5K         5K       100K       100K         5K         5K        100K       100K
Ops/wd   2         32          2         32          2         32          2         32
            MFLOPS     MFLOPS     MFLOPS     MFLOPS     MFLOPS     MFLOPS     MFLOPS     MFLOPS
Minute   °C     x2  °C     x2  °C     x2  °C     x2  °C     x2  °C     x2  °C     x2  °C     x2

      0  65         65         65         65         51         51         51         51
    0.5  96   4716  91  10168  85   3639  95   9135  70   4662  73   9344  72   3150  77   9242
      1  98   3362  94   4756  89   3630  94   4416  75   4627  78   9513  77   3351  81   9892
    1.5  91   2076  87   4443  91   3636  91   4347  78   4446  81   9520  80   3512  84   9515
      2  87   2054  86   4452  91   3631  89   4403  81   4520  83   9526  81   3274  86   9297
    2.5  85   2054  85   4235  92   3632  87   4457  82   4654  84   9635  83   3426  87   9559
      3  84   2036  84   4237  93   3630  85   4384  83   4378  85   9631  84   3385  89   9342
    3.5  82   3098  83   4376  93   3642  85   4404  84   4198  86   9639  85   3389  90   9807
      4  89   4773  83   4420  94   3626  84   4439  84   4644  87   9560  85   3214  91  10173

Max      98   4773  94  10168  94   3642  95   9135  84   4662  87   9639  85   3512  91  10173
Min      65   2036  65   4235  65   3626  65   4347  51   4198  51   9344  51   3150  51   9242
Diff     33   2737  29   5933  29     16  30   4788  33    464  36    295  34    362  40    931
|