Linux MultiProcessor Burn-In and Reliability Tests
Contents
Summary
These programs are intended to stress test CPUs, caches, RAM, buses, disks and other drives using high processing speeds, to induce heating effects, and varying data bit order, to investigate possible pattern conscious faults. Common features are command line options to specify memory/storage demands, running time and different results log file names, for use in multiprocessor tests. Data read and results of calculations are also checked for correct or consistent values. Versions compiled to run on 32-Bit and 64-Bit processors are provided.
Three new programs provided are BurnInSSE, IntBurn and DriveStress but they can also be used in conjunction with program produced earlier. BurnInSSE64 and BurnInSSE32 were compiled to use the same range of SSE floating point instructions, where GCC generates fast execution speeds. The IntBurn tests are based on assembly code with IntBurn32 using 32 bit integers and IntBurn64 accessing a larger number of 64 bit registers.
DriveStress32 and DriveStress64 were compiled from the same C code and measure drive and bus speeds (e.g. SATA or USB) whilst checking data read for correct values.
Earlier programs, that also have reliability testing options and included in the package, are Livermore Loops and nVidia CUDA benchmarks.
Successes - Three significant problems were identified during testing. The first was apparent excessive temperatures on a desktop PC, compared with earlier measurements via Windows. This was cured by clearing dust out of the CPU heatsink using a compressed air sprayer. Then there were two Linux Peculiarities that seem to be affected by power saving options. A desktop PC with a Core 2 Duo CPU showed a throughput increase of three times using both cores. Here, using one core with “On-Demand” CPU GHz (via Frequency Scaling Monitor), the processor was running at 1.6 GHz instead of 2.4 GHz. Then a laptop, again with a Core 2 Duo PC, overheated, causing the CPU to run at less than half speed. Unlike using Windows, with power on to Ubuntu, initial CPU temperatures were high with the fan not appearing to run as fast as it might. On an apparent random basis, the laptop started at a lower temperature and did not overheat, with the fan apparently running at high speed.
Paging/Swapping Tests - Running multiple copies of the processor exercise programs, with appropriate parameters to demand more main memory capacity than is available, will lead to data being swapped out/in to/from disk. However, with excessive demands, running times can be unpredictable.
Multitasking Scripts - Examples are provided showing how to mix and match programs and run time parameter to soak test complete systems for as long as is required. They also demonstrate how to organise dynamic displayed results in multiple X terminal windows.
To Start
General
These tests exercise the hardware at high speeds using a wide variety of number values or data patterns with results being checked for correctness. The programs are intended as an aid in reproducing intermittent faults that might be heat or pattern conscious related.
Multiple copies can be run concurrently, via a shell script, to test multiprocessors, each copy producing its own log file. Parameters are provided to specify a choice of tests and running time. Normally, one or more results are produced per minute, particularly to identify changes in speed introduced by thermal management and to show where any wrong calculations start to be produced.
The programs were compiled at both 32 bits and 64 bits. The execution files, source code, compilation and running instructions can be found in
linux_burn-in_apps.tar.gz.
See also details and results of Windows burn-in tests in
burnin32.htm,
burnin64.htm and
burnin4cpu.htm.
It is useful to measure system temperatures, and possibly fan speeds and voltages, these being available using the sensors command, subject to lm_sensors software being installed. Following shows details produced for a Core 2 Duo processor, where temperatures are available for each CPU core besides those for the processor chip case. Readings quoted later are from the add-on
GNOME Sensors Applet.
 roy@roy-WD32:~$ sensors

 coretemp-isa-0000
 Adapter: ISA adapter
 Core 0:      +43.0°C  (high = +78.0°C, crit = +100.0°C)

 coretemp-isa-0001
 Adapter: ISA adapter
 Core 1:      +43.0°C  (high = +78.0°C, crit = +100.0°C)

 atk0110-acpi-0
 Adapter: ACPI interface
 Vcore Voltage:      +1.15 V  (min =  +0.85 V, max =  +1.60 V)
  +3.3 Voltage:      +3.30 V  (min =  +2.97 V, max =  +3.63 V)
  +5 Voltage:        +5.07 V  (min =  +4.50 V, max =  +5.50 V)
  +12 Voltage:      +12.41 V  (min = +10.20 V, max = +13.80 V)
 CPU FAN Speed:     2500 RPM  (min =  600 RPM)
 CHASSIS1 FAN Speed:1196 RPM  (min =  800 RPM)
 CHASSIS2 FAN Speed:   0 RPM  (min =  800 RPM)
 POWER FAN Speed:      0 RPM  (min =  800 RPM)
 CPU Temperature:    +34.0°C  (high = +60.0°C, crit = +95.0°C)
 MB Temperature:     +30.0°C  (high = +45.0°C, crit = +95.0°C)
|
Note that temperature measurements might not be accurate, but observing increases can demonstrate heat related problems. Also, later recordings, whilst running the same burn-in tests, can suggest that the system needs cleaning or the processor needs reseating.
To Start
BurnInSSE Description
The 64 bit and 32 bit tests, burninsse64 and burninsse32, are based on the OpenMP benchmark described in
openmp mflops.htm,
where the program compiled without OpenMP directives ran very fast, due to the GCC compiler generating optimised code using SSE instructions.
Here, the arithmetic operations executed are of the form x[i] = (x[i] + a) * b - (x[i] + c) * d + (x[i] + e) * f with 2, 8 or 32 operations per data word. The new program has a Section parameter 1, 2 and 3 respectively, the latter being the default. There are also parameters for KWords with a default of 100 (400 KBytes), log file number (default log0.txt) and running time in minutes (default 1). Results are reported every 15 seconds.
Below is a sample log file and details of run time parameters.
  ##############################################

  Assembler CPUID and RDTSC
  CPU GenuineIntel, Features Code BFEBFBFF, Model Code 000006F6
  Intel(R) Core(TM)2 CPU          6600  @ 2.40GHz
  Measured - Minimum 2402 MHz, Maximum 2402 MHz
  Linux Functions
  get_nprocs() - CPUs 2, Configured CPUs 2
  get_phys_pages() and size - RAM Size  2.89 GB, Page Size 4096 Bytes
  uname() - Linux, roy-64Bit, 2.6.35-24-generic
  #42-Ubuntu SMP Thu Dec 2 02:41:37 UTC 2010, x86_64

  ##############################################

  64 Bit MFLOPS Burn-In Test 1.0 Thu Mar 10 15:22:51 2011

                  Via Ubuntu 64 Bit Compiler

 Using 400 KBytes, 32 Operations Per Word, For Approximately 1 Minutes

   Pass    4 Byte  Ops/   Repeat    Seconds   MFLOPS          First   All
            Words  Word   Passes                            Results  Same

      1    100000    32    67500      15.10    14304    0.356166393   Yes
      2    100000    32    67500      15.11    14296    0.356166393   Yes
      3    100000    32    67500      15.09    14312    0.356166393   Yes
      4    100000    32    67500      15.33    14091    0.356166393   Yes

                   End at Thu Mar 10 15:23:54 2011

  ##############################################

    Run Time Parameters
    S or Section 1, 2 or 3 for 2, 8 or 32 operations per word
    L or Logfile number N = 0 to 99 for name logN.txt
    K or KW or KWords cache or RAM data words used
    M or Minutes for running time

    Example Script to test four CPUs
   ./burninsse32 L 1, S 2, KW 10, M 1, &
   ./burninsse32 L 2, S 2, KW 10, M 1, &
   ./burninsse32 L 3, S 2, KW 10, M 1, &
   ./burninsse32 L 4, S 2, KW 10, M 1
|
To Start
BurnInSSE Temperatures
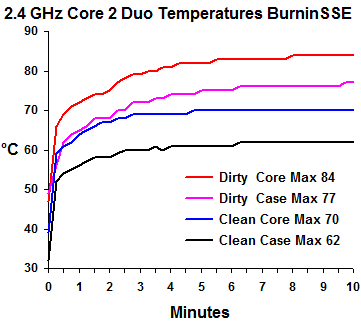
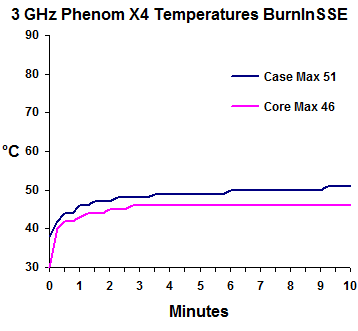
Following are results on dual core Intel and quad core AMD processors, running the same tests and producing 40 speed measurements over 10 minutes. Core and case temperatures are available for the Intel CPU at 32 bit working but not at 64 bits, where only case temperature is provided. In the case of AMD, the core temperature seems to be too low and readings are similar to others produced by various monitors under Windows.
Temperatures measured on the Intel processor appeared to be rather excessive but were similar to those obtained under Windows, but running a different burn-in program. For the latter, measurements were made by SpeedStep, which was calibrated for earlier tests (offset added to measured temperatures) -
see in64.htm.
Rerunning tests, reported in the latter, showed that temperatures had increased significantly. On opening the PC case, the CPU heatsink was found to be clogged up with dust. After blowing out the dust with a compressed air spray, the Linux tests were rerun and measured maximum temperatures were 14°C to 15°C lower, as shown in the graph below.
With both Intel and AMD CPUs, more than four SSE floating point operations were produced per clock cycle, indicating that multiply and add arithmetic pipe lines are linked to potentially produce up to eight results per clock.
 Intel(R) Core(TM)2 CPU  6600  @ 2.40GHz        AMD Phenom(tm) II X4 945 Processor
 #42-Ubuntu SMP UTC 2010, i686                  #42-Ubuntu SMP UTC 2010, i686
 32 Bit MFLOPS Burn-In Test 1.0 Fri Mar 11      32 Bit MFLOPS Burn-In Test 1.0 Thu Mar 10
 400 KBytes, 32 Operations/Word, 10 Minutes     400 KBytes, 32 Operations/Word, 10 Minutes

                  MIN      AVG      MAX                     MIN      AVG      MAX
                MFLOPS   MFLOPS   MFLOPS                  MFLOPS   MFLOPS   MFLOPS

   Dirty CPU 1   12601    13422    13589           CPU 1   14233    14647    14792
   Dirty CPU 2   13076    13412    13595           CPU 2   14451    14717    14785
   Clean CPU 1   11880    13394    13633           CPU 3   14172    14540    14773
   Clean CPU 2   12823    13532    13650           CPU 4   14690    14769    14782
|
To Start
BurnInSSE Cache/RAM Speed Core 2 Duo
Following are log file results from tests on the Core 2 Duo based PC, with parameters to use L1 cache, L2 cache and RAM, at 20 KB, 400 KB and 40 MB. The 400 KB results are a little faster than the earlier example, probably due to the running sequence filling the cache in a different way.
Data transfer speed has also been calculated as shown in the table. The approriate parameters can be arranged to produce maximum data transfer speed or maximum MFLOPS. At 40 MB, performance is clearly limited by RAM speed. Note that, with 2500 minimum repeat passes, test running time between reports can be much longer than 15 seconds. You can close Terminal if too long, and earlier test results will be in the log. Considering heating effects, temperature generally increases with higher MFLOPS, in all cases.
The programs were run with CPU GHz displayed via the Frequency Scaling Monitor on a Panel. It was found that this enabled power saving, whereby the processor can run at 1.6 GHz instead of 2.4 GHz. At first, the tests ran at the lower frequency when one copy was executed but at full speed when both CPUs were used. Clicking on the icon allowed the choice of running continuously at 2.4 GHz. Both sets of results are shown in the table.
The calculated results eventually converge to a constant value, leading to the same answers with different repeat passes.
 CPU   4 Byte  Ops/   Repeat Seconds  MFLOPS         First   All    Calc     1 CPU  1 CPU
        Words  Word   Passes                       Results  Same  MB/Sec    MFLOPS MB/Sec

  1      5000     2  9462500   15.00    6308   0.400158763   Yes   12616   @  4250   8500
  2      5000     2  9487500   15.00    6325   0.400158763   Yes   12650   #  6357  12714

  1      5000     8  4832500   15.01   12881   0.540158510   Yes    6440   @  8660   4330
  2      5000     8  4835000   15.00   12893   0.540158510   Yes    6447   # 12950   6475

  1      5000    32  1347500   15.01   14365   0.352167547   Yes    1796   @  9650   1206
  2      5000    32  1345000   14.98   14364   0.352167547   Yes    1796   # 14430   1803

  1    100000     2   355000   15.10    4702   0.400158763   Yes    9404   @  3730   7460
  2    100000     2   355000   15.08    4709   0.400158763   Yes    9418   #  5563  11126

  1    100000     8   240000   15.07   12743   0.540158510   Yes    6345   @  8720   4360
  2    100000     8   237500   15.03   12644   0.540158510   Yes    6333   # 13024   6512

  1    100000    32    70000   15.56   14398   0.355482936   Yes    1800   @  9680   1233
  2    100000    32    67500   15.09   14317   0.356166393   Yes    1790   # 14465   1808

  1  10000000     2     2500   78.85     634   0.929538310   Yes    1268   @  1090   2180
  2  10000000     2     2500   79.66     628   0.929538310   Yes    1258   #  1238   2476

  1  10000000     8     2500   80.08    2498   0.957117260   Yes    1249   @  4300   2150
  2  10000000     8     2500   80.57    2482   0.957117260   Yes    1241   #  4890   2445

  1  10000000    32     2500   81.07    9868   0.890211046   Yes    1234   @  9370   1171
  2  10000000    32     2500   80.38    9952   0.890211046   Yes    1244   # 13560   1695

                        @ Power Saving Enabled   # Power Saving Disabled
|
To Start
Other BurnInSSE Speeds and Temperatures
Below are MFLOPS speeds and associated temperature increases, at 2 and 32 operations per word, using data in L1 cache (20 KB), L2 cache (400 KB) and RAM (40 MB), on various systems. Test durations were all set to produce 16 test results over 4 minutes (minimum).
The first system is a Netbook with an Intel Atom CPU that has a single CPU with hyperthreading and appears to demonstrate dual core performance. This has a low MFLOPS/CPU MHz ratio, where available case temperatures were low and did not increase much with two versions of the program running.
Next are further results for the Core 2 Duo PC, after cleaning. This time some speeds for a single CPU are slower than expected, but it is not clear why. Also, some tests using one CPU produce rather high temperature increases.
Unlike Windows, Ubuntu appears to use one CPU continuously, for single program tests. Perhaps CPU temperature differences trigger switching to a slower clock speed and the high temperatures did not quite reach that point.
The third results are for the quad core Phenom based PC. Here it seems that temperature increases are more dependent on data transfer speeds and, if the temperatures are correct, high performance can be produced without increasing temperatures that much.
Below are speed and temperatures measured on a laptop, using both processors of a Core 2 Duo CPU. After some difficulty, an ISA bus CPU core temperature monitor was made to work. The tests clearly demonstrated power saving/overheating protection, with clock speeds reduced to less than half when temperatures exceeded 98°C or so - Maximum TJunction specification is 100°C. On one occasion, the system turned off the power in the middle of a test.
Later tests, with results also shown below, did not suffer from performance degradations due to high temperatures and no explanation for the earlier overheating could be found.
           Netbook Atom 1.7 GHz   Core 2 Duo 2.4 GHz          Phenom X4 3 GHz
                   Start °C 54           Start °C 34    42          Start °C  38    30
                          Case                  Case  Core                  Case  Core
Words  OPW  CPUs  MFLOPS   °C+    CPUs  MFLOPS   °C+   °C+    CPUs  MFLOPS   °C+   °C+

   5K    2     1     888     7       1    4250     5     7       1    7936     6    10
              1+H   1508    10       2   12600    22    25       4   32160    14    20

   5K   32     1    1850     8       1    9125     7     8       1   14763     5    10
              1+H   3540    10       2   27060    28    28       4   58960    13    17

 100K    2     1     770     9       1    5880    18    21       1    6814     6     8
              1+H   1040    12       2    9600    22    26       4   28830    14    20

 100K   32     1    1820     8       1    9100     8     8       1   14765     5     9
              1+H   3460    11       2   27150    28    29       4   59010    12    16

  10M    2     1     660    12       1    1260    14    16       1    2194     5     8
              1+H    618    12       2    1250    14    17       4    3280     6    12

  10M   32     1    1801    10       1    8880     8     9       1   13800     5     5
              1+H   3500    12       2   19900    26    26       4   45750    11    16

                         Ops/word  2  MB/second = MFLOPS x 2
                         Ops/word 32  MB/second = MFLOPS / 8


          Overheating Core 2 Duo Laptop 1.83 GHz
  Words    5K           5K         100K         100K          10M          10M
 Ops/wd     2           32            2           32            2           32
         Core MFLOPS  Core MFLOPS  Core MFLOPS  Core MFLOPS  Core MFLOPS  Core MFLOPS
 Minute    °C   x2      °C   x2      °C   x2      °C   x2      °C   x2      °C   x2

      0    65           65           65           65           65           65
    0.5    96   4716    91  10168    85   3639    95   9135    80   *429    86  *6715
    1.0    98   3362    94   4756    89   3630    94   4416    82           91
    1.5    91   2076    87   4443    91   3636    91   4347    83           92
    2.0    87   2054    86   4452    91   3631    89   4403    83           93
    2.5    85   2054    85   4235    92   3632    87   4457    84   *425    94  *3755
    3.0    84   2036    84   4237    93   3630    85   4384    84           87
    3.5    82   3098    83   4376    93   3642    85   4404    84           85
    4.0    89   4773    83   4420    94   3626    84   4439    84           84
          Later
      0    51           51           51           51           51           51
    0.5    70   4662    73   9344    72   3150    77   9242    66           73
    1.0    75   4627    78   9513    77   3351    81   9892    69           78
    1.5    78   4446    81   9520    80   3512    84   9515    71   *445    80  *6487
    2.0    81   4520    83   9526    81   3274    86   9297    72           83
    2.5    82   4654    84   9635    83   3426    87   9559    73           84
    3.0    83   4378    85   9631    84   3385    89   9342    74   *400    85  *6175
    3.5    84   4198    86   9639    85   3389    90   9807    74           86
    4.0    84   4644    87   9560    85   3214    91  10173    75           87

                                                          * Average over 2 minutes as
                                                           running time > 0.5 minutes
|
To Start
IntBurn64 Description
This 64 bit program compilation uses assembly code and eight 64 bit integer registers (r8 to r15) that are not used with 32 bit code. It has twelve tests, adding and subtracting different data patterns. The first six tests alternately write and read data and the others are read only. The results are checked for correct calculations. Parameters are available for data size in KBytes, log file number and elapsed time per test in seconds. On running, results are displayed every 10 seconds or less. An example of the log and parameters are shown below.
Details of the system used, as shown for BurnInSSE, are also included.
###############################################################

           Linux 64 Bit Version 1.0 Integer Reliability Test

                   Copyright (C) Roy Longbottom 2011

  Batch Command Log 1, KB 4, Secs 20,

  Test 4 KB at 10x2 seconds per test, Start at Thu Mar 17 12:00:59 2011

 Write/Read
  1   10529 MB/sec  Pattern 0000000000000000 Result OK   25705389 passes
  2   10579 MB/sec  Pattern FFFFFFFFFFFFFFFF Result OK   25826660 passes
  3   10592 MB/sec  Pattern A5A5A5A5A5A5A5A5 Result OK   25858754 passes
  4   10587 MB/sec  Pattern 5555555555555555 Result OK   25846727 passes
  5   10601 MB/sec  Pattern 3333333333333333 Result OK   25880968 passes
  6   10602 MB/sec  Pattern F0F0F0F0F0F0F0F0 Result OK   25883259 passes
 Max   2236 64 bit MIPS
 Read
  1   16941 MB/sec  Pattern 0000000000000000 Result OK   82719400 passes
  2   16946 MB/sec  Pattern FFFFFFFFFFFFFFFF Result OK   82744300 passes
  3   16932 MB/sec  Pattern A5A5A5A5A5A5A5A5 Result OK   82676600 passes
  4   16927 MB/sec  Pattern 5555555555555555 Result OK   82653700 passes
  5   16883 MB/sec  Pattern 3333333333333333 Result OK   82439400 passes
  6   16857 MB/sec  Pattern F0F0F0F0F0F0F0F0 Result OK   82311300 passes
 Max   2515 64 bit MIPS

             Reliability Test Ended Thu Mar 17 12:04:59 2011

 ###############################################################

   Run Time Parameters
  K or KB or KBytes cache or RAM data size used        - Default 4 KB
  S or Secs for running time per test (12 x S overall) - Default 1 second
  L or Log number N = 0 to 99 for name BurlogN.txt     - Default Burnlog0.txt

   Example Script to test four CPUs
  ./intburn64 Log 1, KB 250, Secs 20 &
  ./intburn64 Log 2, KB 250, Secs 20 &
  ./intburn64 Log 3, KB 250, Secs 20 &
  ./intburn64 Log 3, KB 250, Secs 20

 ###############################################################
|
To Start
IntBurn64 Results
Below are speeds and temperature increases on the four systems used for other tests, but via 64-Bit Ubuntu. Except for the netbook, temperature increases are not as high as those using the SSE floating point programs and show throughput increases proportional to the number of CPUs used, with data from caches. The Phenom also demonstrates exceptional performance. With the Atom, hyperthreading does not help in increasing data transfer speed with two concurrent test programs running but single processor speeds are relatively fast, compared with CPU MHz.
Netbook performance degradation with two programs could be due to demanding too much space in the single caches but, other runs with lower demands, produced similar performance.
          Atom 1.7 GHz      C2D  2.4 GHz      Laptop C2D 1.8 GHz    Phenom X4 3 GHz

     Start °           54°C              34°C              51°C                  38°C 30°C

     CPUs  MB/s   MB/s Case  MB/s   MB/s Case  MB/s   MB/s Core CPUs MB/s   MB/s Case Core
 Data     Wr/Rd    Rd  °C+  Wr/Rd    Rd  °C+  Wr/Rd    Rd  °C+      Wr/Rd    Rd  °C+  °C+

 20KB  1   6020  10250   9  12090  16754  10   7485  12830  23   1  29563  31841   4    4
      1+H  5660   7420  10  24062  33600  18  14680  25100  30   4 117208 126820  11   16

400KB  1   4120   4540  11  10080  13086  16   7570   9945  21   1  14963  21533   4    4
      1+H  2720   5000  15  17820  25200  20  13300  18950  31   4  53288  70585  12   16

 40MB  1   1920   3900  13   3020   5100   7   2420   4380  24   1   5317   6307   4    7
      1+H  1980   4470  15   3700   6160  18   2510   4470  30   4   9097  14797   8   12
|
To Start
IntBurn32
A 32 bit version of the program is also available. This uses the same sequence of load, add, subtract and store assembly code instructions as the 64 bit version but limited in scope due to fewer registers being available. Using caches, performance is dependent on CPU speed, where 64 bit operations can be as fast as those at 32 bits. This means that maximum 32 bit speeds in MB/second will, at best, be half that via the 64 bit version. As can be seen, this applied to reading tests but not those for writing and reading.
Results for the desktop Core 2 Duo are shown running at full speed of 2.4 GHz and when “on demand” use for power saving is selected and the CPU runs at 1.6 GHz. This is wrong when one core is being used, as the CPU should switch to the highest GHz.
Below are result for the laptop, reported earlier as overheating. The first three sets of figures are when using a single CPU then both cores, with average MB/second for the latter. Next are temperatures measured at one minute intervals for four minute tests. In two cases, heating effects lead to a reduction in speed and a later increase after cooling. Experiments showed that, unlike using Windows, the CPU fan appeared not to be running until temperature increased significantly.
Next are results for a further four minute test at 400 KB, where no speed degradation was reported using both cores. The last results are for a 12 minute test when it was noticed that the CPU fan appeared to be running at full speed after booting, with idle temperature at around 50 °C. As when using BurnInSSE, the higher temperatures were not produced and speed of both CPUs were almost as fast as those from a single processor test. The three different modes of operation appeared to be on a random basis after booting and changing GHz and power saving options in the CPU Frequency Scaling Monitor utility made no difference.
Note that further tests confirmed that the same variations occur with IntBurn64.
       Atom               C2D 1.6 GHz        C2D 2.4 GHz        Phenom
       CPUs   MB/s   MB/s CPUs   MB/s   MB/s CPUs   MB/s   MB/s CPUs   MB/s   MB/s
 Data        Wr/Rd     Rd       Wr/Rd     Rd       Wr/Rd     Rd       Wr/Rd     Rd

  20KB    1   1820   5215    1   2470   5660    1   3700   8480    1   6192  15971
         1+H  2150   4635    2   7370  16880    2   7370  16880    4  24621  63672

 400KB    1   1570   3260    1   2400   5020    1   3580   7530    1   5385  12313
         1+H  1670   4200    2   6870  14860    2   6990  14860    4  21577  48572

  40MB    1   1130   3080    1   1800   4300    1   2350   5240    1   3072   5178
         1+H  1320   4200    2   3000   6080    2   3940   6040    4   7110  13507


          Overheating Core 2 Duo Laptop 1.83 GHz
                                                                400 KB      400 KB
          20 KB 4 Mins      400 KB 4 Mins     40 MB 4 Mins      4 Mins      12 Mins

          1 CPU Av/CPU °C   1 CPU Av/CPU °C   1 CPU Av/CPU °C  Av/CPU °C   Av/CPU °C
           MB/s   MB/s       MB/s   MB/s       MB/s   MB/s       MB/s        MB/s

       0               65                65                65         65          48
   Wr/Rd
       1   2666   2618       2759   2036       1648   1073       2401        2661 71
       2   2671   2629       2759   2036       1689   1077       2455        2657 76
       3   2627   2590 92    2713   1986 95    1667   1071 95    2330 96     2618 78
       4   2627   2586       2711    866       1671    654       2459        2613 80
       5   2627   2592       2713    873       1668    467       2450        2618 82
       6   2627   2592 91    2711    872 85    1667    465 87    2455 93     2618 82
     Rd
       1   6424   6338       5755   1819       4191    976       5245        5592 81
       2   6424   6337       5745   1818       4176    976       5261        5592 83
       3   6430   6343 89    5751   1981 85    4196    976 83    5238 91     5591 83
       4   6428   6335       5746   4207       4177    975       5249        5590 84
       5   6428   6339       5754   4201       4195   2080       5237        5589 84
       6   6431   6340 88    5743   4183 89    4119   2272 88    5242 89     5593 84
|
To Start
Paging/Swapping Tests
In specifying appropriate memory space to use, BurnInSSE and IntBurn tests can be used to demonstrate and exercise all available memory and use of the swap file. Below is an example of a script file to run four copies of IntBurn, each demanding 1 GB. After that are results on running the programs on the 2.4 GHz Core 2 Duo PC that has 4 GB RAM, initially with 2.9 GB free.
The commands specify log file numbers and these are included on the Terminal display as the programs are running to demonstrate out of sequence execution. A part number is also shown, where more than one are used when specified running time is 20 seconds or greater. Anyway, this time is a minimum and can be significantly longer for one pass to write/read or read all the data, as shown below where where one pass takes more than 220 seconds.
When running four programs using memory with no paging, more than 40 passes are used for 10 seconds with writing and reading, then greater than 150 for the read only tests. Corresponding throughput per program are around 900 and 1500 MB/second.
Although total recorded time is about one hour for each program, actual elapsed time is two hours, as the writing and reading/verifying before the read only passes is not included.
In this case, Linux gave the same resources to each program for all the writing/reading tests and the first three read only tests. Then, each of the third and fourth programs (L53 and L54) were run to completion as the only task being executed, followed by the other two together, using both CPUs.. Note that the running time for this sort of test is unpredictable. For example, an earlier run was completed in less than half an hour.
  Command Script File
   ./intburn64 Log 51, KB 1000000, Secs 10 &
   ./intburn64 Log 52, KB 1000000, Secs 10 &
   ./intburn64 Log 53, KB 1000000, Secs 10 &
   ./intburn64 Log 54, KB 1000000, Secs 10

  Run Time Terminal Display
 L52P   1 Test 1 of 6, Pattern 0000000000000000, 223.9 Secs,       9 MB/S
 L51P   1 Test 1 of 6, Pattern 0000000000000000, 224.6 Secs,       9 MB/S
 L54P   1 Test 1 of 6, Pattern 0000000000000000, 228.2 Secs,       9 MB/S
 L53P   1 Test 1 of 6, Pattern 0000000000000000, 230.0 Secs,       9 MB/S
Later
 L53P   1 Test 3 of 6, Pattern A5A5A5A5A5A5A5A5,  10.0 Secs,    4091 MB/S
 L53P   1 Test 4 of 6, Pattern 5555555555555555,  10.2 Secs,    5224 MB/S
 L53P   1 Test 5 of 6, Pattern 3333333333333333,  10.1 Secs,    5173 MB/S
 L53P   1 Test 6 of 6, Pattern F0F0F0F0F0F0F0F0,  10.1 Secs,    5167 MB/S
 L54P   1 Test 3 of 6, Pattern A5A5A5A5A5A5A5A5,  10.1 Secs,    5057 MB/S
 L54P   1 Test 4 of 6, Pattern 5555555555555555,  10.1 Secs,    5058 MB/S
 L54P   1 Test 5 of 6, Pattern 3333333333333333,  10.0 Secs,    5111 MB/S
 L54P   1 Test 6 of 6, Pattern F0F0F0F0F0F0F0F0,  10.0 Secs,    5120 MB/S
 L51P   1 Test 3 of 6, Pattern A5A5A5A5A5A5A5A5,  10.3 Secs,    2597 MB/S
 L52P   1 Test 3 of 6, Pattern A5A5A5A5A5A5A5A5,  10.2 Secs,    2913 MB/S

  Test Seconds
          Write/Read Test                     Read Test
          1     2     3     4     5     6     1     2     3     4     5     6  Total

 L51P   225   381   634   631   558   575   302   332    10    10    10    10   3677
 L52P   224   391   615   636   553   597   299   336    10    10    10    10   3692
 L53P   230   361   504   579   553   655   315   431    10    10    10    10   3667
 L54P   228   364   501   581   538   653   306   435    10    10    10    10   3646
|
To Start
Livermore Loops
The Livermore Loops benchmark
can also be used as a burn-in test, where parameters are available to vary the running time of each of the 24 kernels and the calculation sensitive numeric results are checked for correctness. Some results and temperatures for the Windows version are in
burnin4cpu.htm.
Multi-processor tests can be run using the commands shown below with results written to a common log file (that appears to work). The 24 kernels are run three times. So, at 5 seconds per test, total running time should be around six minutes.
Both 32 bit and 64 bit versions are available and are included in
linux_burn-in_apps.tar.gz.
The benchmark was converted to a burn-in/reliablity test (long run time options and logging any errors) after if caused crashes on overclocked Pentium Pro PCs. The main advantage is that it uses a wide range of floating point calculations and produces sensitive checksums. It does not generate temperatures as high as with BurnInSSE, like case/core up to 56/66°C compared with 62/70°C on the 2.4 GHz Core 2 Duo, but it can vary up and/or down 5°C over a minute.
  Parameter Script File for 2 CPUs
 At 5 seconds per test

 ./lloops_64 5 &  or for 32 bit version ./lloops 5 &
 ./lloops_64 5                          ./lloops 5

 Extra parameter N or NoPause to close terminal at end

  Terminal Display as tests are running
 Kernel       Floating Pt ops
 No  Passes E No    Total      Secs.  MFLOPS Span     Checksums          OK
 ------------ -- ------------- ----- ------- ---- ---------------------- --
  1  40 x 206  5  1.664480e+09  1.00 1662.33  101  5.253344778937972e+02 16
  2  40 x 209  4  1.297472e+09  1.00 1298.21  101  1.539721811668385e+03 15
  3  53 x 344  2  1.473146e+09  1.00 1468.89  101  1.009741436578952e+00 16
  4  70 x 395  2  1.327200e+09  1.00 1326.34  101  5.999250595473891e-01 16
  5  55 x  77  2  3.388000e+08  1.00  338.21  101  4.589031939600982e+01 16
  6   7 x 367  2  9.864960e+08  1.00  986.40   32  8.631675645333210e+01 16
  7  22 x 163 16  2.317990e+09  1.00 2306.90  101  6.345586315784055e+02 16
  8   6 x 179 36  3.062189e+09  1.00 3058.21  100  1.501268005625795e+05 15
  9  21 x 142 17  2.048038e+09  1.00 2049.83  101  1.189443609974981e+05 16

  Log File Progress and Results - 2 CPU Test
 In the event of checksum differences, details are included in the log.

 Reliability test   5 seconds each loop x 24 x 3

 Part 1 of 3 start at Tue Apr  5 12:53:14 2011
 Part 1 of 3 start at Tue Apr  5 12:53:14 2011
 Part 2 of 3 start at Tue Apr  5 12:55:11 2011
 Part 2 of 3 start at Tue Apr  5 12:55:14 2011
 Part 3 of 3 start at Tue Apr  5 12:57:11 2011
 Part 3 of 3 start at Tue Apr  5 12:57:15 2011

 Numeric results were as expected

 MFLOPS for 24 loops
 1675.1 1281.2 1568.6 1510.3  340.1 1189.2 2477.4 3037.9 2045.9  768.2  787.7  860.6
  478.3  609.6  440.5  963.3 1012.9 1220.2  458.3  422.2 1241.9  349.9 1175.4  791.3

 Overall Ratings
 Maximum Average Geomean Harmean Minimum
  3045.4  1080.4   912.1   774.0   336.5

 Numeric results were as expected

 MFLOPS for 24 loops
 1685.8 1287.2 1573.5 1515.5  341.1 1181.7 2488.3 3036.5 2051.2  768.8  788.5  862.6
  478.9  611.8  441.5  961.5 1001.5 1217.7  457.3  421.6 1238.3  349.6 1172.1  789.7

 Overall Ratings
 Maximum Average Geomean Harmean Minimum
  3045.1  1083.3   914.5   776.0   337.1
|
To Start
Disk and Bus Test
This program uses the same procedures as one of the test programs designed to run under Operating Systems during
UK Government Computer Acceptance Trials
that were carried out in the 1970s and 1980s. Its main successes were identifying a data pattern conscious design fault on the I/O system of Serial #1 CDC Cyber 205 supercomputer and a case of reading the wrong file on a top end IBM 360 running the, then new, MVS Operating System at a NSA type security department.
DriveStress64 and DriveStress32 are 64-Bit and 32-Bit compilations of the program. The default versions write four files, using 164 blocks of 64 KB (10.25 MB), with each block containing a unique data pattern (shown below). The files are then read for two minutes, on a sort of random sequence (see below), with data and file ID checked for correct values. Using modern disk drives, with read ahead, data transfer speed will be maintained by reading from the disk’s buffer. Finally, each block is read repetitively from one file for one second at maximum bus speed from the buffer (subject to overheads for that block size and other overheads). In order to maintain fast data transfer, values are checked every 20 passes. Total time is normally about 4.75 minutes for all tests.
Run time parameters are available to use larger file sizes (same running time), file reading minutes, block reading seconds, log file number and data file path. The latter allows external disk and flash drives to be selected for testing. For more details on path selection see
linux_disk_usb_lan_benchmarks.htm
and parameters below. The log file numbers are also included in the data file names, to ensure that multiple tests use different files.
NOTE that it is wise to use different log numbers for all DriveStress tests in a script, as Linux appears to sometimes start a batch of tests before an earlier one has finished.
 Patterns
 No.    Hex No.     Hex No.     Hex No.     Hex  No.     Hex No.      Hex No.      Hex

  1       0 25   800000 49        3 73       FF  97 FFFFDFFF 121 FFFFEAAA 145 FFFFF0F0
  2       1 26  1000000 50       33 74   FF00FF  98 FFFFBFFF 122 FFFFAAAA 146 FFF0F0F0
  3       2 27  2000000 51      333 75      1FF  99 FFFF7FFF 123 FFFEAAAA 147 F0F0F0F0
  4       4 28  4000000 52     3333 76      3FF 100 FFFEFFFF 124 FFFAAAAA 148 FFFFFFE0
  5       8 29  8000000 53    33333 77      7FF 101 FFFDFFFF 125 FFEAAAAA 149 FFFF83E0
  6      10 30 10000000 54   333333 78      FFF 102 FFFBFFFF 126 FFAAAAAA 150 FE0F83E0
  7      20 31 20000000 55  3333333 79     1FFF 103 FFF7FFFF 127 FEAAAAAA 151 FFFFFFC0
  8      40 32 40000000 56 33333333 80     3FFF 104 FFEFFFFF 128 FAAAAAAA 152 FFFC0FC0
  9      80 33        1 57        7 81     7FFF 105 FFDFFFFF 129 EAAAAAAA 153 FFFFFF80
 10     100 34        5 58      1C7 82     FFFF 106 FFBFFFFF 130 AAAAAAAA 154 FFE03F80
 11     200 35       15 59     71C7 83 FFFFFFFF 107 FF7FFFFF 131 FFFFFFFC 155 FFFFFF00
 12     400 36       55 60   1C71C7 84 FFFFFFFE 108 FEFFFFFF 132 FFFFFFCC 156 FF00FF00
 13     800 37      155 61  71C71C7 85 FFFFFFFD 109 FDFFFFFF 133 FFFFFCCC 157 FFFFFE00
 14    1000 38      555 62        F 86 FFFFFFFB 110 FBFFFFFF 134 FFFFCCCC 158 FFFFFC00
 15    2000 39     1555 63      F0F 87 FFFFFFF7 111 F7FFFFFF 135 FFFCCCCC 159 FFFFF800
 16    4000 40     5555 64    F0F0F 88 FFFFFFEF 112 EFFFFFFF 136 FFCCCCCC 160 FFFFF000
 17    8000 41    15555 65  F0F0F0F 89 FFFFFFDF 113 DFFFFFFF 137 FCCCCCCC 161 FFFFE000
 18   10000 42    55555 66       1F 90 FFFFFFBF 114 BFFFFFFF 138 CCCCCCCC 162 FFFFC000
 19   20000 43   155555 67     7C1F 91 FFFFFF7F 115 FFFFFFFE 139 FFFFFFF8 163 FFFF8000
 20   40000 44   555555 68  1F07C1F 92 FFFFFEFF 116 FFFFFFFA 140 FFFFFE38 164 FFFF0000
 21   80000 45  1555555 69       3F 93 FFFFFDFF 117 FFFFFFEA 141 FFFF8E38
 22  100000 46  5555555 70    3F03F 94 FFFFFBFF 118 FFFFFFAA 142 FFE38E38
 23  200000 47 15555555 71       7F 95 FFFFF7FF 119 FFFFFEAA 143 F8E38E38
 24  400000 48 55555555 72   1FC07F 96 FFFFEFFF 120 FFFFFAAA 144 FFFFFFF0

 Sequences - First 16
 No.   File         No.   File          No.   File          No.   File

  1    0  1  2  3    5    0  2  1  3     9    0  3  1  2    13    0  1  2  3
  2    1  2  3  0    6    1  3  2  0    10    1  0  3  2    14    1  2  3  0
  3    2  3  0  1    7    2  0  1  3    11    2  1  0  3    15    2  3  0  1
  4    3  0  2  1    8    3  1  2  0    12    3  2  1  0    16    3  0  2  1

 Input Parameters
 Determined by upper or lower case first character

 L - log file number N for IOStressN.txt   M - Minutes to read all files
 S - Seconds to read each block of 1 file  R - file size Repeat multiplier x 10.25 MB
 F - File path for drive or partition      C - Use Linux RAM based File Cache

 Example: ./drivestress64 Log 0, Mins 2, Secs 1, Repeats 1,  FilePath ~/all64/burndis
|
To Start
Disk and Bus Test Results
Below is an example log file and error report. Note that results are logged every 0.25 minutes for the file reading tests and every second on repetitive block reading. The same information is displayed as the tests are running.
Example results are also shown for SATA and USB disk drives and a Flash Memory stick. File reading speeds are somewhat slower than those produced using performance tests, due to the overheads from verifying data correctness and not the most optimum block size. Repeat reading via the eSATA drives is slower than the SATA disk on the netbook, the former working at SATA 1 speeds and the latter at SATA 2. These results are similar to those for other benchmarks at 64 KB block size.
Some results are also shown using the parameter that tells Linux to cache the data in RAM. Here, reading and rereading tests are more than 40 times faster than processing data from the disk.
  Log File
 Current Directory Path:
 /home/roy/all64/burndisk
 Total MB   11263, Free MB    9497, Used MB    1766

 Linux Storage Stress Test 64-Bit Version 1.1, Sun Apr 17 20:06:07 2011

                Copyright (C) Roy Longbottom 2011

 File size   10.25 MB x 4 files, minimum reading time 2 minutes

 File 1   10.25 MB written in    0.12 seconds
 File 2   10.25 MB written in    0.14 seconds
 File 3   10.25 MB written in    0.11 seconds
 File 4   10.25 MB written in    0.14 seconds


              Start Reading Sun Apr 17 20:06:07 2011

 Read passes    18 x 4 Files x   10.25 MB in     0.25 minutes
 Read passes    36 x 4 Files x   10.25 MB in     0.51 minutes
 Read passes    54 x 4 Files x   10.25 MB in     0.76 minutes
 Read passes    72 x 4 Files x   10.25 MB in     1.01 minutes
 Read passes    89 x 4 Files x   10.25 MB in     1.25 minutes
 Read passes   107 x 4 Files x   10.25 MB in     1.50 minutes
 Read passes   125 x 4 Files x   10.25 MB in     1.75 minutes
 Read passes   143 x 4 Files x   10.25 MB in     2.01 minutes

            Start Repeat Read Sun Apr 17 20:08:08 2011

 Passes in 1 second(s) for each of 164 blocks of 64KB:

   1440   1480   1480   1480   1480   1400   1480   1480   1480   1460   1380
   1480   1480   1460   1480   1440   1440   1480   1480   1480   1440   1460
   1480   1440   1480   1460   1500   1460   1480   1760   1540   1480   1480
   1440   1480   1480   1480   1480   1460   1440   1480   1480   1480   1460
   1480   1460   1500   1480   1480   1420   1460   1480   1480   1480   1480
   1680   1740   1540   1480   1480   1380   1460   1480   1500   1480   1480
   1440   1480   1480   1460   1480   1420   1480   1480   1480   1460   1460
   1440   1460   1460   1480   1480   1420   1480   1480   1480   1480   1480
   1540   1700   1480   1500   1480   1440   1520   1740   1740   1740   1740
   1460   1480   1480   1480   1480   1500   1760   1760   1760   1760   1660
   1460   1500   1480   1500   1480   1420   1460   1480   1480   1460   1500
   1460   1480   1480   1480   1460   1420   1440   1480   1460   1480   1480
   1440   1480   1460   1480   1480   1400   1460   1460   1480   1480   1480
   1440   1480   1480   1480   1380   1380   1460   1460   1480   1480   1480
   1440   1480   1480   1460   1480   1360   1460   1460   1480   1480

 244260 read passes of 64KB blocks in     2.75 minutes

  No errors found during reading tests

              End of test Sun Apr 17 20:10:53 2011

  Error Messages
 Pass 1480 file szzztestz1 word 99, data error was 0000FFFF expected 00000040

  Example Speeds
                                             Read All       Repeat Read
                Disk     Disk    Write   Files/           Passes/
   System       Type      RPM   MB/sec   2 Mins   MB/sec   Second   MB/sec

   Desktop     eSATA     7200     77.4    141x4     48.2     1462     93.6
   DeskTop       USB     7200     13.5     34x4     11.6      410     26.2
   Desktop       USB    Flash      4.3     46x4     15.7      261     16.7
   Desktop     eSATA     5400     56.9    112x4     38.3     1481     94.7
   Netbook      SATA     5400     51.3     97x4     33.1     2210    141.4

  Using File Cache - ./drivestress64 C
 File 4   10.25 MB written in    0.02 seconds

 Read passes  6030 x 4 Files x   10.25 MB in     2.00 minutes

 Passes in 1 second(s) for each of 164 blocks of 64KB:
  64500  63780  64180  64080  64100  65500  64220  63700  64460  64220  64200
 10637460 read passes of 64KB blocks in     2.73 minutes
|
To Start
CUDA Tests For nVidia Graphics
CUDA, from nVidia, provides programming functions to use GeForce graphics processors for general purpose computing. These functions are easy to use in executing arithmetic instructions on numerous processing elements simultaneously. This is for Single Instruction Multiple Data (SIMD) operation, where the same instructions can be executed simultaneously on sections of data from a data array. For maximum speeds, the data array has to be large and with little or no references to graphics or host CPU RAM. To assist in this, CUDA hardware provides a large number of registers and high speed cache like memory.
The benchmarks measure floating point speeds in Millions of Floating Point Operations Per Second (MFLOPS). They demonstrates some best and worst case performance using varying data array size and increasing processing instructions per data access. There are five scenarios - New Calculations with data in and out, Update Data with just data out, Graphics Only Data using only graphics RAM and two extra tests with lower overheads.
The tests are run at three different data sizes, defaults 100,000 words repeated 2500 times, 1M words 250 times and 10M words 25 times. The arithmetic operations executed are of the form x[i] = (x[i] + a) * b - (x[i] + c) * d + (x[i] + e) * f with 2, 8 or 32 adds or subtracts and multiplies on each data element. The Extra Tests are only run using 10M words repeated 25 times.
The 32 and 64 bit benchmarks, source code and instructions can be downloaded in
linux_cuda_mflops.tar.gz
with more details and results in
linux_cuda_mflops.htm.
The execution files are also included in
linux_burn-in_tests.tar.gz.
Necessary 64 bit and 32 bit library files, libcudart.so.3, are also included. With Terminal pointing to the directory containing the benchmark files, execute the following command to provide access - export LD_LIBRARY_PATH=$LD_LIBRARY_PATH:/
The reliability test is run if the command line includes a minutes parameter. Then, default data size and operations per word are 10 million and 32, generally producing the fastest speed, particularly when the extra FC parameter is included to run the fast Shared Memory test.
Run time parameters and example log file results are shown below.
 Run Time Parameters

 Threads (or t or T)                      Words (or w or W)
 Minutes (or M or m or Mins)              Seconds (or S or s or Secs) - reporting rate
 FC - to use fast Shared Memory test      Repeats (or r or R) - adjusted for Seconds

 Default 32 bit version reliability test

 ./cudamflops32SP T 256, W 10000000, R 2, M ?, S 15

 #####################################################

  Linux CUDA 3.2 x86 32 Bits SP MFLOPS Benchmark 1.4 Fri Apr  8 17:13:33 2011

  CUDA devices found
  Device 0: GeForce GTS 250  with 16 Processors 128 cores
  Global Memory 999 MB, Shared Memory/Block 16384 B, Max Threads/Block 512

  Using 256 Threads

  Shared Memory  Reliability Test 1 minutes, report every 15 seconds

  Repeat CUDA 791 times at  1.44 seconds. Repeat former 10 times
  Tests - 10000000 4 Byte Words, 32 Operations Per Word, 7910 Repeat Passes

  Results of all calculations should be -    0.7116522192955017

  Test Seconds   MFLOPS    Errors     First               Value
                                       Word

    1   14.386   175950   None found
    2   14.410   175657   None found
    3   14.381   176006   None found
    4   14.387   175939   None found
|
To Start
CPU and GeForce Graphics Burn-In Tests
Following are example results and temperatures when running the CUDA program at the same time as BurnInSSE CPU tests.
If different programs are run using a single script file, as above, all the output appears in a single window, making it difficult to see what is happening. In this case, the xterm command is used to run the CUDA program using a second Terminal window.
In fact, all programs could be run using different screen positions via xterm added parameter -geometry 80x25+pixelsa+pixelsd, where 80x25 is window size in characters and the others screen position in pixels.
When the CUDA program is run by itself, System Monitor indicates that one CPU will show 100% utilisation and additional demands can be on other processors. When run with BurrnInSSE, the CUDA program appears to run at nearly full speed but there will be some degradation on the processor tests.
CPU Temperature increases are not as high as processor only tests but graphics processors appear to run much hotter under these loads.
    run3cp1gp Script File
  ./burninsse32 KW 5, Section 3, Mins 10, L 1 &
  ./burninsse32 KW 5, Section 3, Mins 10, L 2 &
  ./burninsse32 KW 5, Section 3, Mins 10, L 3 &
  xterm -e ./cudamflops32SP Mins 10, FC


  Quad Core 3.0 GHz Phenom, GeForce GTS 250

       Stand                                                                          Max
       Alone                                                                         Over
       ----------------------------------- MFLOPS ----------------------------------- 15s

 CP 1  14698  11956  11439  11678  11847  12382  11474  11720  12337  11605  14687  14698
 CP 2         11915  11986  11587  11623  11738  12146  12047  11190  11495  11589  13322
 CP 3         12206  11895  12043  11967  11791  11935  11565  12058  12749  14698  14703
 GPU  176006 175857 175899 175798 175904 175852 175852 175855 175839 175941 175990 176026

 Minute    0      1      2      3      4      5      6      7      8      9     10
                                                                                     Rise
       ------------------------------------- °C  ----------------------------------------

 Core     36     46     48     49     50     51     52     52     52     52     52     16
 Case     43     49     51     52     54     54     55     55     55     56     56     13
 Board    36     36     37     37     38     39     39     40     40     40     40      4
 GPU      48     69     74     75     75     76     76     76     76     76     76     28

  Core 2 Duo 2.4 GHz,  GeForce 8600 GT

       Stand                                                                          Max
       Alone                                                                         Over
       ----------------------------------- MFLOPS ----------------------------------- 15s

 CPU   14468   9535   9465   9426   9088   8493   9895   9321   9401  10263   9697  13357
 GPU   34512  34480  34465  34479  34461  34463  34472  34489  34457  34471  34485  34510

 Minute    0      1      2      3      4      5      6      7      8      9     10
                                                                                     Rise
       ------------------------------------- °C  ----------------------------------------

 Case     35     53     54     54     56     56     58     57     57     58     59     24
 Board    28     28     28     28     29     29     29     29     29     29     29      1
 GPU      50     63     65     67     68     68     68     68     68     68     68     18
|
To Start
Tests With Hyperthreading
The reliability tests were run on a 3.7 GHz Core i7, that has 4 cores plus Hyperthreading, booting to Ubuntu 14.04. Psensor was installed and, in addition to the temperatures displayed by the sensors command (see below), also displays GPU temperature and overall CPU utilisation. Initially, burninsse64 and intburn64 were run with data sizes to use all caches. It was found that, L3 cache tests produced the highest temperatures, with the highest from burninsse64.
Running four copies of these tests indicated 50% CPU utilisation. Eight copies were needed to indicate 100%, but, of course, total throughput was not increased in line with the number of programs. Utilisation of 18% was indicated running the CUDA Shared Memory test, suggesting 100% utilisation of one core and 44% of another. So, the tests, with results below, were run using six copies of burninsse64 and the CUDA test.
The script used produced seven separate windows on a 1920x1080 monitor, with space to display a Terminal window and Psensor readings. On temperature recording, it is not clear what Physical id 0: represents. It seems to show the highest core temperature and this can vary significantly on adjacent recording samples.
Average performance and temperatures. over a minute are shown below. CUDA MFLOPS were fairly constant but total burninsse64 results varied somewhat, with Hyperthreading sometimes producing greater than four times that for a single core. Maximum temperatures were not excessive.
  Core i7 3.7 GHz,  GeForce GTX 650
 Script

 # SSE Floating Point Tests L3 Cache

 xterm -geometry 80x22+10+10    -e ./burninsse64 KW 512, Section 3, Mins 10, Log 71 &
 xterm -geometry 80x22+600+10   -e ./burninsse64 KW 512, Section 3, Mins 10, Log 72 &
 xterm -geometry 80x22+1190+10  -e ./burninsse64 KW 512, Section 3, Mins 10, Log 73 &
 xterm -geometry 80x22+10+360   -e ./burninsse64 KW 512, Section 3, Mins 10, Log 74 &
 xterm -geometry 80x22+600+360  -e ./burninsse64 KW 512, Section 3, Mins 10, Log 75 &
 xterm -geometry 80x22+1190+360 -e ./burninsse64 KW 512, Section 3, Mins 10, Log 76 &
 xterm -geometry 80x22+10+710   -e ./cudamflops64SP Mins 10, FC

 Example Sensors Command and highest temperatures

   roy@roy-i7UB14:~$ sensors
   coretemp-isa-0000
   Adapter: ISA adapter
   Physical id 0:  +66.0°C  (high = +86.0°C, crit = +100.0°C)
   Core 0:         +63.0°C  (high = +86.0°C, crit = +100.0°C)
   Core 1:         +61.0°C  (high = +86.0°C, crit = +100.0°C)
   Core 2:         +61.0°C  (high = +86.0°C, crit = +100.0°C)
   Core 3:         +66.0°C  (high = +86.0°C, crit = +100.0°C)

 Results

       Stand                                                                          Max
       Alone                                                                         Over
       ----------------------------------- MFLOPS ----------------------------------- 15s

 4 CPU 90000  85579  98945  83260  95890  85500  85717  87934  97047  98902 109085 115910
 GPU  429746 429816 429822 429788 429803 429816 429784 429813 429770 429772 429797 429885


 Minute    0      1      2      3      4      5      6      7      8      9     10
                                                                                     Rise
       ------------------------------------- °C  ----------------------------------------

 CPUs     32     55     58     60     61     62     62     63     63     63     63     31
 GPU      30     46     53     56     58     59     59     60     60     60     60     30
|
To Start
Burn-In Scripts
32 bit and 64 bit versions of the following script files are included in
linux_burn-in_apps.tar.gz.
The parameters in the runalot script can be adjusted for the running time of a complete cycle of all the tests and suggestions are given for the twelve sets of four tests to execute for 10 minutes each, or 2 hours overall. Running the runcycles script then repeats these as many time as ./runalot is included.
Running two cycles of the tests, using the initial parameters, took between 40 minutes and an hour on systems with one to four CPUs. With the timing method used, running multiple copies can lead to fewer passes on each program, possibly producing the same overall running time irrespective of the number of CPUs. Seven of the batches took around 1 minute each, the other five having the DriveStress tests, with a minimum of 1 minute reading time and 164 repeat tests at 1 second each. Thus, two cycles can use at least 37 minutes running the drive tests.
The least predicable timing will be for the Paging Integer Tests. For these, fifteen xterm windows are used. The screen positions for these were arrange for a monitor at 1280 x 1024 pixels but is still usable at 1024 x 600.
  runcycles
 ./runalot
 ./runalot

  runalot
 seconds=5       # Integer Tests            -  12 tests at seconds each  - change to =50
 minutes=1       # SSE Floating Point Tests -  all tests in minutes      - change to =10
 minutesC=1      # CUDA nVidia GPU Test     -  running time in minutes   - change to =10
 secondsP=2      # Paging Integer Tests     -  12 tests at secondsP each - change to =10
 secondsL=1      # Livermore Loops          - 24x3 tests                 - change to =8
 kbytes=2048     # Paging Integer Tests     -  Uses 15 copies of kbytes
                 # RAM 1 GB use =70000, 2 GB =140000, 4 GB =280000, 8 GB 560000
 reps=1          # Drive Test 4  files size = 10.3 MB x reps             - change
 mins=1          # Drive Test reading minutes                            - change to =5
 secs=1          # Drive Test repeat reading time x 164 blocks           - change to =2
 C or Cache      # Use RAM based cache

 Replace $seconds or $minutes with a number

 # Integer Tests L1 Cache

 xterm -geometry 80x25+10+10   -e ./intburn32 KBytes 4, Secs $seconds, Log 1 &
 xterm -geometry 80x25+600+10  -e ./intburn32 KBytes 4, Secs $seconds, Log 2 &
 xterm -geometry 80x25+10+500  -e ./intburn32 KBytes 4, Secs $seconds, Log 3 &
 xterm -geometry 80x25+600+500 -e ./intburn32 KBytes 4, Secs $seconds, Log 4

 # SSE Floating Point Tests L1 Cache

 xterm -geometry 80x25+10+10   -e ./burninsse32 KW 1, Section 3, Mins $minutes, Log 1 &
 xterm -geometry 80x25+600+10  -e ./burninsse32 KW 1, Section 3, Mins $minutes, Log 2 &
 xterm -geometry 80x25+10+500  -e ./burninsse32 KW 1, Section 3, Mins $minutes, Log 3 &
 xterm -geometry 80x25+600+500 -e ./burninsse32 KW 1, Section 3, Mins $minutes, Log 4

 # Integer Tests L2 Cache + RAM?

 xterm -geometry 80x25+10+10   -e ./intburn32 KBytes 256, Secs $seconds, Log 1 &
 xterm -geometry 80x25+600+10  -e ./intburn32 KBytes 256, Secs $seconds, Log 2 &
 xterm -geometry 80x25+10+500  -e ./intburn32 KBytes 256, Secs $seconds, Log 3 &
 xterm -geometry 80x25+600+500 -e ./intburn32 KBytes 256, Secs $seconds, Log 4

 # SSE Floating Point Tests L2 Cache + RAM?

 xterm -geometry 80x25+10+10   -e ./burninsse32 KW 64, Section 3, Mins $minutes, Log 1 &
 xterm -geometry 80x25+600+10  -e ./burninsse32 KW 64, Section 3, Mins $minutes, Log 2 &
 xterm -geometry 80x25+10+500  -e ./burninsse32 KW 64, Section 3, Mins $minutes, Log 3 &
 xterm -geometry 80x25+600+500 -e ./burninsse32 KW 64, Section 3, Mins $minutes, Log 4

 # Integer Tests RAM

 xterm -geometry 80x25+10+10   -e ./intburn32 KBytes 16384, Secs $seconds, Log 1 &
 xterm -geometry 80x25+600+10  -e ./intburn32 KBytes 16384, Secs $seconds, Log 2 &
 xterm -geometry 80x25+10+500  -e ./intburn32 KBytes 16384, Secs $seconds, Log 3 &
 xterm -geometry 80x25+600+500 -e ./intburn32 KBytes 16384, Secs $seconds, Log 4

 # ************************* Paging Integer Tests *************************

 xterm -geometry 65x10+0+10    -e ./intburn32 KBytes $kbytes, Secs $secondsP, Log 31 &
 xterm -geometry 65x10+420+10  -e ./intburn32 KBytes $kbytes, Secs $secondsP, Log 32 &
 xterm -geometry 65x10+840+10  -e ./intburn32 KBytes $kbytes, Secs $secondsP, Log 33 &

 xterm -geometry 65x10+0+200   -e ./intburn32 KBytes $kbytes, Secs $secondsP, Log 34 &
 xterm -geometry 65x10+420+200 -e ./intburn32 KBytes $kbytes, Secs $secondsP, Log 35 &
 xterm -geometry 65x10+840+200 -e ./intburn32 KBytes $kbytes, Secs $secondsP, Log 36 &

 xterm -geometry 65x10+0+390   -e ./intburn32 KBytes $kbytes, Secs $secondsP, Log 37 &
 xterm -geometry 65x10+420+390 -e ./intburn32 KBytes $kbytes, Secs $secondsP, Log 38 &
 xterm -geometry 65x10+840+390 -e ./intburn32 KBytes $kbytes, Secs $secondsP, Log 39 &

 xterm -geometry 65x10+0+580   -e ./intburn32 KBytes $kbytes, Secs $secondsP, Log 40 &
 xterm -geometry 65x10+420+580 -e ./intburn32 KBytes $kbytes, Secs $secondsP, Log 41 &
 xterm -geometry 65x10+840+580 -e ./intburn32 KBytes $kbytes, Secs $secondsP, Log 42 &

 xterm -geometry 65x10+0+770   -e ./intburn32 KBytes $kbytes, Secs $secondsP, Log 43 &
 xterm -geometry 65x10+420+770 -e ./intburn32 KBytes $kbytes, Secs $secondsP, Log 44 &
 xterm -geometry 65x10+840+770 -e ./intburn32 KBytes $kbytes, Secs $secondsP, Log 45

 # ************************* Mixed Disk and CPU Tests *************************

 xterm -geometry 80x25+10+10   -e ./intburn32 KBytes 4, Secs $seconds, Log 1 &
 xterm -geometry 80x25+600+10  -e ./burninsse32 KW 1, Section 3, Mins $minutes, Log 1 &
 xterm -geometry 80x25+10+500  -e ./drivestress32 M $mins, S $secs, R $reps, Log 1 &
 xterm -geometry 80x25+600+500 -e ./drivestress32 M $mins, S $secs, R $reps, Log 2, C

 xterm -geometry 80x25+10+10   -e ./drivestress32 M $mins, S $secs, R $reps, Log 3, C &
 xterm -geometry 80x25+600+10  -e ./intburn32 KBytes 16384, Secs $seconds, Log 1 &
 xterm -geometry 80x25+10+500  -e ./intburn32 KBytes 16384, Secs $seconds, Log 2 &
 xterm -geometry 80x25+600+500 -e ./lloops Nopause, $secondsL

 # ************************* 4 Cached Disk Tests *************************

 xterm -geometry 80x25+10+10   -e ./drivestress32 M $mins, S $secs, R $reps, Log 4, C &
 xterm -geometry 80x25+600+10  -e ./drivestress32 M $mins, S $secs, R $reps, Log 5, C &
 xterm -geometry 80x25+10+500  -e ./drivestress32 M $mins, S $secs, R $reps, Log 6, C &
 xterm -geometry 80x25+600+500 -e ./drivestress32 M $mins, S $secs, R $reps, Log 7, C

 # ************************* Floating Point and GeForce CUDA *************************

 export LD_LIBRARY_PATH=$LD_LIBRARY_PATH:/
 xterm -geometry 80x25+10+10   -e ./burninsse32 KW 1, Section 3, Mins $minutes, Log 1 &
 xterm -geometry 80x25+600+10  -e ./burninsse32 KW 1, Section 3, Mins $minutes, Log 2 &
 xterm -geometry 80x25+10+500  -e ./lloops Nopause, $secondsL &
 xterm -geometry 80x25+600+500 -e ./cudamflops32SP Mins $minutesC, FC

 # ************************* Integer, SSE, Disk,  CUDA *************************

 xterm -geometry 80x25+10+10   -e ./intburn32 KBytes 4, Secs $seconds, Log 1 &
 xterm -geometry 80x25+600+10  -e ./burninsse32 KW 64, Section 3, Mins $minutes, Log 1 &
 xterm -geometry 80x25+10+500  -e ./drivestress32 M $mins, S $secs, R $reps, Log 8, C &
 xterm -geometry 80x25+600+500 -e ./cudamflops32SP Mins $minutesC, FC

 # ********************* Integer RAM, Cached Disk,  CUDA *********************

 xterm -geometry 80x25+10+10   -e ./intburn32 KBytes 16384, Secs $seconds, Log 1 &
 xterm -geometry 80x25+600+10  -e ./intburn32 KBytes 16384, Secs $seconds, Log 2 &
 xterm -geometry 80x25+10+500  -e ./drivestress32 M $mins, S $secs, R $reps, Log 9, C &
 xterm -geometry 80x25+600+500 -e ./cudamflops32SP Mins $minutesC, FC
|
To Start
Roy Longbottom january 2015
The Internet Home for my PC Benchmarks is via the link
Roy Longbottom's PC Benchmark Collection
|