Roy Longbottom at Linkedin OpenSUSE and SUSE Raspberry Pi 3 64 Bit Stress Tests


Contents


General FPU MFLOPS Test Integer MB/second Test Monitoring and Tests Run
FPU Stress Test Integer Stress Test SUSE Enterprise Server Assembly Code


General

Raspberry Pi 3 has a 64 bit ARM Cortex-A53 CPU, but available operating systems have been 32 bit versions. The first reference I have seen, for a 64 bit variety, was for OpenSuse. There are different distros available, one for SUSE Linux Enterprise Server. The intention is to recompile existing benchmarks to work at 64 bits.

On running the first conversions, it was found that performance could be disappointingly slow and inconsistent. This problem is due to the system booting with a parameter that sets the CPU frequency to operate on demand, varying between 600 and 1200 MHz. and that caused the speed performance changes. The SD card drive booting partition, config.txt, has a parameter force_turbo=0 that sets on demand. Changing this to force_turbo=1 implies performance mode, with the clock running continuously at 1200 MHz, so it seemed. Then, the benchmarks ran at full speed.

A second temporary workaround was suggested in the OpenSUSE forum, indicating that “performance” or “on demand” can be set via the cpupower terminal command (see below). Given the ability to demonstrate maximum performance of a single threaded benchmark, at a fixed 1200 MHz, raises the question of what will happen when all cores are run at maximum speeds, such as demonstrated in Raspberry Pi 2 and 3 Stress Tests, where the CPU clock gradually reduces in speed to avoid overheating.

The most important floating point and integer stress tests have been compiled to run at 64 bits, both having parameters that can be used to run with data from caches or RAM. The first results below, for single core tests, further demonstrate variable speeds using on demand CPU frequency settings, consistent speeds with the performance option, and example results via caches and RAM. This is followed by multi-thread test results, using all four cores. in this case, CPU speed is reduced in small increments as temperature increases, in the same way as running earlier tests via Raspbian OS.

It could be concluded that OpenSuse behaves as might be expected, using multiple cores, and it would seem to be more appropriate to boot the system using “performance” CPU frequency setting.

The stress test progams and source code can be downloaded from SuseRpi3Stress.tar.gz

Other results for 64 bit benchmark conversions will be included in the report on Raspberry Pi, Pi 2 and Pi 3 Benchmarks.

To Start

Maximum MFLOPS - burninfpuPi64

Arithmetic operations executed are of the form x[i] = (x[i] + a) * b - (x[i] + c) * d + (x[i] + e) * f with 2, 8 or 32 operations per input data word. The same variables are used for each word and final results are checked for consistency, any errors being reported. The benchmark has input parameters for KWords, Section 1, 2 or 3 (for 2, 8 or 32 operations per word) and log number (0 to 99).

Following are results from running one copy of the program, demonstrating that, in this case, average MFLOPS speed, using on demand frequency setting, is 52% of that with the performance option. The latter is also 31% faster than the Original 32 Bit scores.

Different Parameters - Results provided below show that maximum speeds are produced with data from caches, using eight operations per word. Speeds using 32 calculations are particularly disappointing. see Assembly Code for an explanation.


 ############################### On demand ###############################

   Default Setting
   cpupower -c all frequency-set -g ondemand
   Default Parameters for ./burninfpuPi64

    Burn-In-FPU SUSE/ARM 64 Sat Jan 14 15:50:39 2017

 Using 12 KBytes, 8 Operations Per Word, For Approximately 1 Minutes

   Pass     4 Byte  Ops/   Repeat    Seconds   MFLOPS          First   All
             Words  Word   Passes                            Results  Same

      1       3200     8  1180000      15.07     2005    0.539296687   Yes
      2       3200     8  1180000      15.78     1915    0.539296687   Yes
      3       3200     8  1180000      14.43     2094    0.539296687   Yes
      4       3200     8  1180000      15.33     1971    0.539296687   Yes

                   End at Sat Jan 14 15:51:39 2017


 ############################## Performance ##############################

   cpupower -c all frequency-set -g performance
   Default Parameters for ./burninfpuPi64

    Burn-In-FPU SUSE/ARM 64 Sat Jan 14 15:54:26 2017

 Using 12 KBytes, 8 Operations Per Word, For Approximately 1 Minutes

   Pass     4 Byte  Ops/   Repeat    Seconds   MFLOPS          First   All
             Words  Word   Passes                            Results  Same

      1       3200     8  2250000      15.03     3832    0.539296687   Yes
      2       3200     8  2250000      15.03     3832    0.539296687   Yes
      3       3200     8  2250000      15.03     3832    0.539296687   Yes
      4       3200     8  2250000      15.03     3832    0.539296687   Yes

                   End at Sat Jan 14 15:55:26 2017
 
 ######################### Different Parameters ##########################

   Area     4 Byte  Ops/   Repeat    Seconds   MFLOPS          First   All
             Words  Word   Passes                            Results  Same

  L1 cache    8000     2  1592000      15.00     1698    0.400158763   Yes
              8000     8   876000      15.02     3733    0.539296687   Yes
              8000    32    92000      15.05     1564    0.352537483   Yes

  L2 cache   40000     2   308800      15.00     1647    0.400158763   Yes
             40000     8   177200      15.02     3774    0.539296687   Yes
             40000    32    18400      15.08     1562    0.516640484   Yes

     RAM   2000000     2     1672      15.04      445    0.951906323   Yes
           2000000     8     1664      15.06     1768    0.970994949   Yes
           2000000    32      360      15.06     1530    0.982915401   Yes
  

To Start

Maximum Integer MB/Second - stressintPi64

This has six tests that alternately write and read data and six tests using write once and read many times, each test using two data patterns out of 24 variations. Some are shown in the results. The read phase comprises an equal number of additions and subtractions, with the data being unchanged afterwards. This is checked for correctness, at the end of each test, and any errors reported. Run time parameters are provided for KBytes memory used, seconds for each of the twelve tests and log number for use in multitasking. Default parameters are shown below.

Again are results of on demand and performance settings, using default run time parameters, demonstrating the wide performance variation in the former, worst case being around half speed.

Different Parameters - Speeds via L1 cache and L2 cache are similar, but the latter could be much slower using multiple tests, where data from all copies overfills the shared cache.


 ############################### On demand ###############################
 
  Default Setting
  cpupower -c all frequency-set -g ondemand
  Default Parameters ./stressintPi64

  Integer Stress Test SUSE/ARM 64 Sat Jan 14 15:52:12 2017

   8 KBytes Cache or RAM Space, 1 Seconds Per Test, 12 Tests

 Write/Read
  1    2368 MB/sec  Pattern 00000000 Result OK     144536 passes
  2    2581 MB/sec  Pattern FFFFFFFF Result OK     157550 passes
  3    2582 MB/sec  Pattern A5A5A5A5 Result OK     157565 passes
  4    1424 MB/sec  Pattern 55555555 Result OK      86907 passes
  5    1290 MB/sec  Pattern 33333333 Result OK      78734 passes
  6    1741 MB/sec  Pattern F0F0F0F0 Result OK     106258 passes
 Read
  1    1468 MB/sec  Pattern 00000000 Result OK     179200 passes
  2    2521 MB/sec  Pattern FFFFFFFF Result OK     307800 passes
  3    2937 MB/sec  Pattern A5A5A5A5 Result OK     358600 passes
  4    2554 MB/sec  Pattern 55555555 Result OK     311800 passes
  5    2937 MB/sec  Pattern 33333333 Result OK     358600 passes
  6    2937 MB/sec  Pattern F0F0F0F0 Result OK     358600 passes

                   End at Sat Jan 14 15:52:24 2017

 ############################## Performance ##############################

  cpupower -c all frequency-set -g performance
  Default Parameters ./stressintPi64

  Integer Stress Test SUSE/ARM 64 Sat Jan 14 16:00:17 2017

   8 KBytes Cache or RAM Space, 1 Seconds Per Test, 12 Tests

 Write/Read
  1    2578 MB/sec  Pattern 00000000 Result OK     157369 passes
  2    2580 MB/sec  Pattern FFFFFFFF Result OK     157441 passes
  3    2580 MB/sec  Pattern A5A5A5A5 Result OK     157488 passes
  4    2580 MB/sec  Pattern 55555555 Result OK     157469 passes
  5    2580 MB/sec  Pattern 33333333 Result OK     157458 passes
  6    2580 MB/sec  Pattern F0F0F0F0 Result OK     157464 passes
 Read
  1    2937 MB/sec  Pattern 00000000 Result OK     358500 passes
  2    2936 MB/sec  Pattern FFFFFFFF Result OK     358500 passes
  3    2937 MB/sec  Pattern A5A5A5A5 Result OK     358500 passes
  4    2936 MB/sec  Pattern 55555555 Result OK     358500 passes
  5    2936 MB/sec  Pattern 33333333 Result OK     358500 passes
  6    2936 MB/sec  Pattern F0F0F0F0 Result OK     358400 passes

                   End at Sat Jan 14 16:00:29 2017


  ######################### Different Parameters ##########################

 Write/Read ./stressintPi64 KB 8 Secs  1
  1    2483 MB/sec  Pattern 00000000 Result OK     151542 passes
 Read
  1    2842 MB/sec  Pattern 00000000 Result OK     346900 passes

 Write/Read ./stressintPi64 KB 40 Secs  1
  1    2582 MB/sec  Pattern 00000000 Result OK      31517 passes
 Read
  1    2776 MB/sec  Pattern 00000000 Result OK      67800 passes

 Write/Read ./stressintPi64 KB 8000 Secs  1
  1    1077 MB/sec  Pattern 00000000 Result OK         66 passes
 Read
  1    1239 MB/sec  Pattern 00000000 Result OK        160 passes
  

To Start

Monitoring and Tests Run

CPU temperatures and MHz need to be measured, on running these stress tests, in order to help to identify reasons for performance variations. The main issue is the CPU clock speed being reduced (throttling) if temperature becomes too high. Under Raspbian, the controlling frequency is identified via the measure_clock arm command, which is not available via SUSE. Instead, data from the normal cpuinfo_cur_freq storage location appears to be used. Also, CPU temperature measurement is via a different procedure, where then sensors application needs to be installed.

In this case, MHz and temperature were noted manually, using the watch command, with 1 second sampling delay, as shown below. This updates the measurements on the screen, without scrolling. The stress tests were also run starting four copies of the program, each in its own Terminal window. Originally, the procedures were kicked of using a script file.

The last RPi 3 tests were run with the system board fitted in a FLIRC enclosure, where the whole aluminium case becomes the heatsink, considerably reducing CPU temperature. This was also used on these tests, where performance remained constant, over the test periods. Further tests were run using a copper heatsink. See Earlier stress test report. These were repeated using on demand and performance CPU frequency options.


 ########################### Measure CPU MHz #############################

 watch -n 1 -p cat /sys/devices/system/cpu/cpu*/cpufreq/cpuinfo_cur_freq

 Every 1.0s: cat /sys/devices/system/cpu/cpu*/cpufreq/cpuinfo_cur_freq

 1200000 (or less)
 1200000
 1200000
 1200000


 ######################### Measure Temperature ###########################

 watch -n 1 sensors

 Every 1.0s: sensors

 bcm2835_thermal-virtual-0
 Adapter: Virtual device
 temp1:        +39.2°C  


To Start

FPU Stress Tests

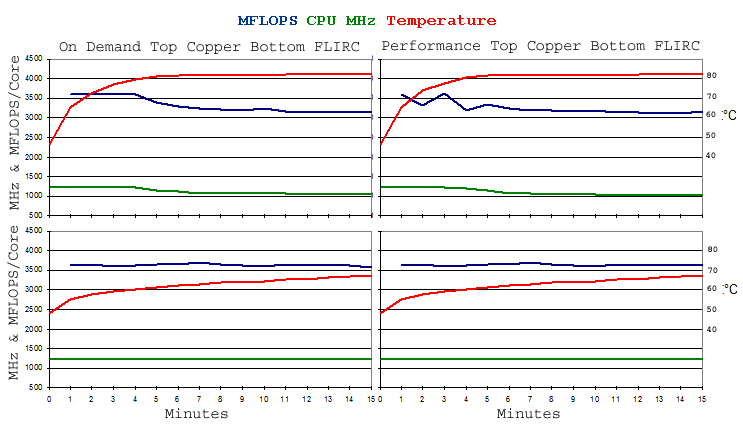
Unlike the single core tests, essentially the same performance was demonstrated, using on demand and performance CPU frequency options. With the FLIRC case, performance was also effectively constant, over the 15 minute tests runs, temperatures still rising but still containable.

On using the copper heatsink, performance degraded as the temperature reached to 80°C, with CPU MHz reductions being displayed. Note that these and the temperature displays were then constantly flickering with slight variations in readings.

The on demand results confirm that the system did not appear to perform correctly, running the single core tests, where these 4 core tests appear to be at least six times faster.


 Example run command  ./burninfpuPi64 Kwords 10 Section 2 Minutes 15 Log 21 
 Log has 4 lines per minute, test is 8 operations per word, using 40 KB of data

 Minute   FLIRC Performance   FLIRC On Demand     Copper Performance  Copper On Demand
          MFLOPS    °C   MHz  MFLOPS    °C   MHz  MFLOPS    °C   MHz  MFLOPS    °C   MHz

    0             47.0                48.0                46.2                46.2
    1      14564  51.5  1200   14450  55.3  1200   14436  65.5  1200   14391  65.5  1200
    2      14584  53.7  1200   14531  57.5  1200   13264  74.1  1200   14431  72.5  1200
    3      14568  55.8  1200   14374  59.1  1200   14499  77.9  1200   14426  76.8  1200
    4      14565  56.9  1200   14478  60.1  1200   12779  80.6  1181   14397  79.5  1200
    5      14548  58.0  1200   14589  61.2  1200   13411  81.7  1141   13593  81.1  1157
    6      14568  59.1  1200   14519  62.3  1200   12963  81.7  1080   13180  81.7  1110
    7      14556  60.1  1200   14749  62.8  1200   12789  81.7  1055   12923  81.7  1077
    8      14575  60.7  1200   14570  63.4  1200   12781  81.7  1038   12906  81.7  1072
    9      14578  60.7  1200   14483  63.9  1200   12634  81.7  1037   12826  81.7  1066
    10     14575  61.8  1200   14431  64.5  1200   12781  81.7  1032   12926  81.7  1060
    11     14555  62.8  1200   14529  65.0  1200   12556  81.7  1026   12666  82.2  1049
    12     14570  63.4  1200   14504  65.5  1200   12560  82.2  1031   12580  82.2  1040
    13     14554  63.4  1200   14533  66.1  1200   12460  82.2  1021   12539  82.2  1041
    14     14561  63.9  1200   14452  66.6  1200   12383  82.2  1022   12568  82.2  1042
    15     14597  64.5  1200   14275  66.6  1200   12445  82.2  1017   12650  82.2  1033

 Average   14566               14514               13021               13311
 Min       14548  51.5  1200   14275  55.3  1200   12383  65.5  1017   12539  65.5  1033
 Max       14597  64.5  1200   14749  66.6  1200   14499  82.2  1200   14431  82.2  1200
 Min/Max    1.00  0.80  1.00    0.97  0.83  1.00    0.85  0.80  0.85    0.87  0.80  0.86

Speed and Temperature


To Start


Integer Stress Tests

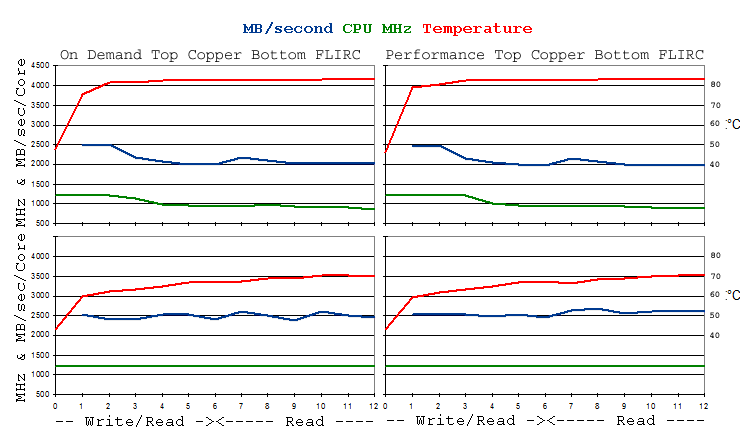
As for the floating point tests, the same performance was demonstrated, using on demand and performance CPU frequency options and performance was constant (within 8%) using the FLIRC case. Surprisingly, the integer tests produced lower CPU throttling MHz than the floating point program, with associated higher temperatures and slower performance.


 Example run command - ./stressIntPi64 KB 40 Seconds 80 Log 31
    12 tests at 80 seconds each, 16 minutes overall, results displayed every 10 seconds

   Test   FLIRC Performance   FLIRC On Demand     Copper Performance  Copper On Demand
          MB/sec    °C   MHz  MB/sec    °C   MHz  MB/sec    °C   MHz  MB/sec    °C   MHz

    0             42.9  1200          42.9  1200          46.2  1200          47.6  1200
    1      10116  59.2  1200   10071  59.8  1200    9863  78.9  1200    9901  75.6  1200
    2      10104  62.0  1200    9645  62.3  1200    9954  80.6  1197    9978  81.7  1138
    3      10085  63.4  1200    9653  63.4  1200    8640  82.2   991    8700  81.7   983
    4       9900  64.9  1200   10071  65.0  1200    8162  82.7   955    8219  82.7   964
    5      10097  66.6  1200   10065  66.9  1200    7983  82.7   936    8030  82.7   939
    6       9825  67.1  1200    9655  66.6  1200    7901  82.7   930    7952  82.7   936
    7      10501  66.4  1200   10434  67.3  1200    8539  82.7   962    8675  82.7   968
    8      10691  68.2  1200    9996  68.6  1200    8267  83.3   927    8414  82.7   932
    9      10249  68.8  1200    9564  68.8  1200    7998  83.3   893    8127  82.7   907
    10     10463  69.7  1200   10446  70.6  1200    7887  83.3   875    8067  83.3   894
    11     10447  70.3  1200    9998  70.5  1200    7876  83.3   887    8059  83.3   857
    12     10495  70.9  1200    9807  69.8  1200    7923  83.3   871    8080  83.3   890

 average   10248                9950                8416                8517
 min        9825  59.2  1200    9564  59.8  1200    7876  78.9   871    7952  75.6   857
 max       10691  70.9  1200   10446  70.6  1200    9954  83.3  1200    9978  83.3  1200
 min/max    0.92  0.84  1.00    0.92  0.85  1.00    0.79  0.95  0.73    0.80  0.91  0.71

Speed and Temperature
   

To Start

SUSE Linux Enterprise Server (SLES)

The stress tests were repeated using SLES, to see if the same on demand and performance settings were provided. They were, with default again being on demand, and measured speed variations no different.

Following are average speeds of stressintPi64, running 6 minute tests at 8 KB, using 1, 2 and 4 cores. With the performance setting, except for a little degradation due to heat effects, with 4 threads, MB/second results were the same. On the other hand, default on demand option produced better performance per core as the load increased. That seems to be the wrong way round.


             On Demand     Performance

 Program   Total Average  Total  Average
  Copies  MB/sec  MB/sec  MB/sec  MB/sec
 
     1      2079    2079    2758    2758
     2      4651    2325    5519    2759
     4     10811    2703   10806    2701


To Start

Assembly Code or Meanderings of an Octogenarian Ancient GEEK

Below are the assembly instructions used for the floating point stress tests. The source code has inner loops with 2, 8 or 32 arithmetic operations, but the compiler unrolls the loops to fully use quad word registers. The first two are unrolled another four times, resulting in four (x 4 way) loads at the start, four (x 4 way) stores at the end, with calculations in between. It seems that there are insufficient register for the 32 operations test, where it ends up with alternate load and arithmetic instructions. The result is that the fastest code is via 8 operations per word.

Of particular interest are vector fmla and fmls instructions, or fused multiply and add or subtract, with the potential of producing 8 operations per CPU clock cycle. Best case here was 3.19 MFLOPS/MHz, for 1 core and 12.16 with 4 cores.

The integer stress test, read only section, has an inner loop that loads 32 four byte words at a maximum speed of 2937 MB/second or 734 MW/second. With 32 arithmetic adds or subtracts, MOPS (Million Operations Per Second) is also 734. With 32 arithmetic operations, 32 data loads, indexing and loop overheads. A total of 99 instructions are used, or 3 per word loaded, leading to an execution speed of 2202 MIPS (Million Instructions Per Second) at 1.835 MIPS/MHz.


 Ops/word        2      2      8      8     32     32
              inst    ops   inst    ops   inst    ops

 overheads       4      4      4      4      4      4
 fadd            4     16     12     48     11     44
 fmla                          4     32      5     40
 fmls                          4     32      5     40
 fmul            4     16      4     16      1      4
 ldr             4     16      4     16     16     64
 str             4     16      4     16      1      4

 Total          20     68     36    164     43    200

 arithmetic            32           128           128
     %                 47            78            64
 unroll                16            16             4

 Overheads   = 2 adds, compare, branch
 Eaample 64 Bit Intructions     
               fxxx    v16.4s, v18.4s, v10.4s
               ldr     q0,  [sp, 272]
               str     q16, [x7, x4]
  

To Start


Roy Longbottom at Linkedin Roy Longbottom January 2017


The Official Internet Home for my Benchmarks is via the link
Roy Longbottom's PC Benchmark Collection